Using BankMyCell, you can sell your old device for cash in 3 simple steps. You'll get all the top quotes from trusted buyback stores in one place, earning you more and saving you time! This means you'll not only get paid the best price online in as little as 2 days, but also receive with FREE shipping & zero hassle returns if you change your mind!
Unlike other trade-in platforms, our buyback partners pay you in cash instead of store credit or gift cards. We're talking higher payouts, with no strings attached, so you can spend a larger sum of money on what you want!


BankMyCell ensures you get the most money for your used iPhone, maximizing its return. Our price comparison website makes sure you access the best deals from online buyback stores.
Selling your iPhone to BankMyCell will get you the best price, check out our comparison of the best places to sell your iPhone. Similar to other Apple products like the Apple Watch, you can also get paid cash via a variety of payment options, unlike other trade-in programs that offer store credit. PLUS, the buyback program takes care of the shipping cost.
You can also take advantage of the following benefits:
BankMyCell also gets you better payouts than local buyback or trade-in stores, compare Apple buyers near you to see for yourself.
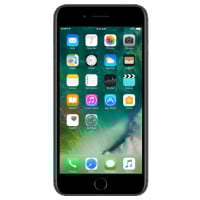
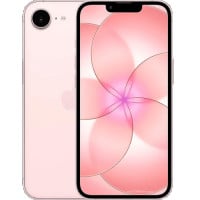
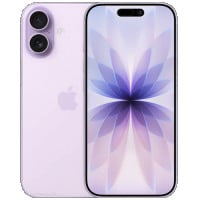
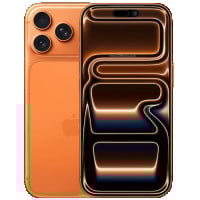
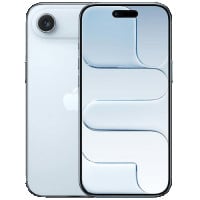
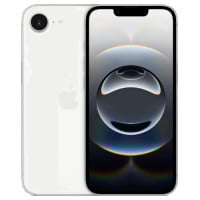
Your iPhone is worth up to $1370.00 today. Depending on where you go, choosing the right buyers to sell your iPhone can earn you up to $174.14 extra - we made a guide on how much your iPhone is worth to show how quotes vary depending on the iPhone model, capacity, condition, and network.
Many folks don't realize how much more they can get paid by picking the right Apple iPhone buyback companies.
Yes, you can sell a broken iPhone at BankMyCell. We offer the best cash prices no matter its condition, ensuring you maximize the value of your device.
Here are the following damaged conditions we accept:
Yes, you can sell used iPhones under any carrier network, including Verizon, AT&T, T-Mobile, and Sprint. But note that unlocked devices tend to get paid more.
Yes, you can trade in your iPhone for cash at BankMyCell even if it is iCloud locked, blacklisted, or under contract. This way, you can use the extra cash to buy a new device.
IMPORTANT NOTE: If the filters at the top of the iPhone product page don't show the locked status, the store will not accept the kind of device.
Go to Settings > Tap General > About > Model Name.
Before selling your iPhone, there are a few easy steps you’ll need to take to make sure your data is wiped, and any iCloud security locks are removed.
All shipping and returns are FREE if you sell old iPhone to BankMyCell. After the selling process, shipping it to your chosen gadget buyback store is the next step.
Got any other used Apple products sitting in your drawers? You can turn them into cash too!
Got more old tech? See our full range of electronics you can sell right here.


BankMyCell: The service offers an independent resale price comparison from popular iPhone trade-in companies. Helpful if you're looking to get paid a specific way, or you want to pick the store that does the longest price freeze, giving you time to upgrade without getting stung by price drops.

Brad Tuttle
Senior Editor at Money.com


-front.jpg)