US Smartphone Market Share (2026)


In 2024, Apple leads the smartphone yearly market share in the United States at 61.26%, followed by Samsung at 22.63%. Together, they have the bulk of the market share, with a total of 83.89% combined. Lenovo-acquired Motorola takes third place at 3.50%.
We are living in a world where smartphones are dominating the market. The US Census Bureau estimated the smartphone sales value at USD 74.7 Billion in 2022-2023. Meanwhile, the global smartphone market share is estimated by Fortune Business Insights to rise to USD 520.2 billion in 2023 at a 7.3% CAGR.
Most Popular Phone Brands in the US (Most Recent Quarter)
| Brand | Quarterly Market Share (%) |
|---|---|
| Apple | 61.26 |
| Samsung | 22.63 |
| Motorola* | 3.5 |
| 2.4 | |
| Xiaomi | 1.14 |
| Others | 9.07 |
*Motorola was acquired by Lenovo in 2014.
Apple is the most popular phone brand in the US in 2024. This is evident based on their 61.26% market share in the country. The company takes the lead with a 38.63% difference from Samsung, which comes in second at 22.63% brand share.
The rest of the phone brands share around 16% of the market share. Motorola, which was acquired by Lenovo, is in third place with 3.50%, followed by Google, Xiaomi, and other brands.
Editors Picks:
- Top 5 smartphone brands in the US: The top 5 brands in the US in Q1 2024 by quarterly market share are Apple at 61.26%, Samsung at 22.63%, Motorola at3.50%, Google at 2.40.%, and Xiaomi at 1.14% market share.
- Top smartphone brand in the US: Apple continues to dominate the market share with 61.26% this quarter, which shows how in-demand iPhones are in the US.
- Second smartphone brand in the US: Samsung comes second in the US with a 22.63% market share in 2024. The company’s market share declined by 2.60% compared to the fourth quarter of 2022.
- Third smartphone brand in the US: Motorola, ranking third, has a 3.50% market share in 2024, a decline of 0.39% compared to Q4 2022.
- Fourth smartphone brand in the US: Google ranks fourth this quarter with a 2.40% market share. It outperformed Xiaomi, with a market share of 1.14%.
- Apple and Samsung in the US: Out of all the smartphone brands, Apple and Samsung take the lion’s share of the US smartphone market, totaling 83.89% combined. The rest of the smartphone brands share around 15% of the market share in the US.
In this Article:
- US Smartphone Market Share (Monthly & Quarterly)
- US Smartphone Market Share (Yearly)
- Apple – US Smartphone Market Data
- Samsung – US Smartphone Market Data
- Samsung Vs Apple – US Smartphone Market Data
- Motorola – US Smartphone Market Data
- Google Pixel – US Smartphone Market Data
- LG – US Smartphone Market Data
US Market Share of Cell Phones
Cellphone Market Share in the US (This Month)
| Brands | Market Share |
|---|---|
| Apple | 61.26 |
| Samsung | 22.63 |
| Motorola* | 3.5 |
| 2.4 | |
| LG | 1.14 |
| Others | 9.07 |
*Motorola was acquired by Lenovo in 2014.
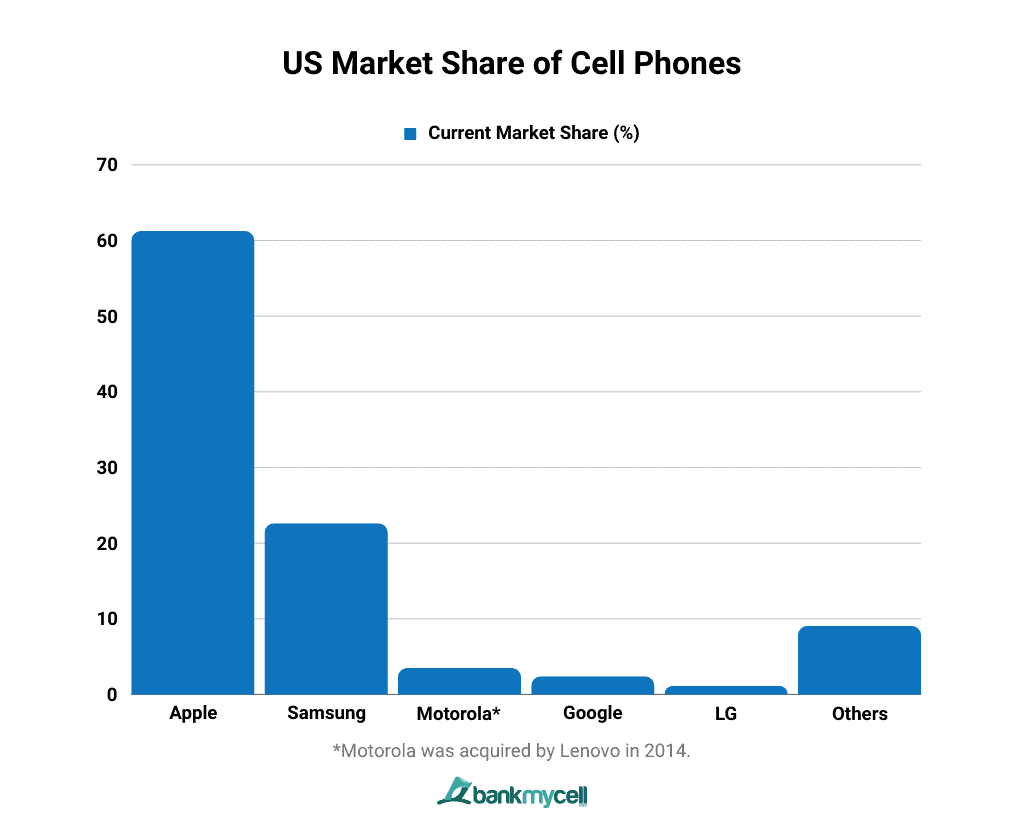
- Data Table
-
Brands Market Share Apple 61.26 Samsung 22.63 Motorola* 3.5 Google 2.4 LG 1.14 Others 9.07 *Motorola was acquired by Lenovo in 2014.
- Data Graph
-

The monthly data for the smartphone market share in America currently shows Apple and Samsung leading all the brands at 61.26% and 22.63% market share, respectively. This indicates that more than half of the earnings made from all smartphone sales in America were from iPhones. Motorola is at the third spot with a 3.50% market share, Google at fourth with 2.40%, and Xiaomi in fifth place with 1.14%.
US Smartphone Market Share (Quarterly)
| Brands | Q1 2023 (%) | Q2 2023 (%) | Q3 2023 (%) | Q4 2023 (%) | Q1 2024 (%) |
|---|---|---|---|---|---|
| Apple | 57.12 | 59.79 | 56.83 | 58.66 | 61.26 |
| Samsung | 29.21 | 26.29 | 26.55 | 24.59 | 22.63 |
| Motorola* | 4.68 | 4.34 | 4.26 | 3.89 | 3.5 |
| 2.11 | 2.11 | 2.48 | 2.56 | 2.4 | |
| Xiaomi | 0.73 | 0.72 | 0.91 | 1.07 | 1.14 |
| LG | 1.74 | 1.47 | 1.14 | 0.87 | 0.66 |
| Others | 4.41 | 5.27 | 7.83 | 8.37 | 8.41 |
*Motorola was acquired by Lenovo in 2014.
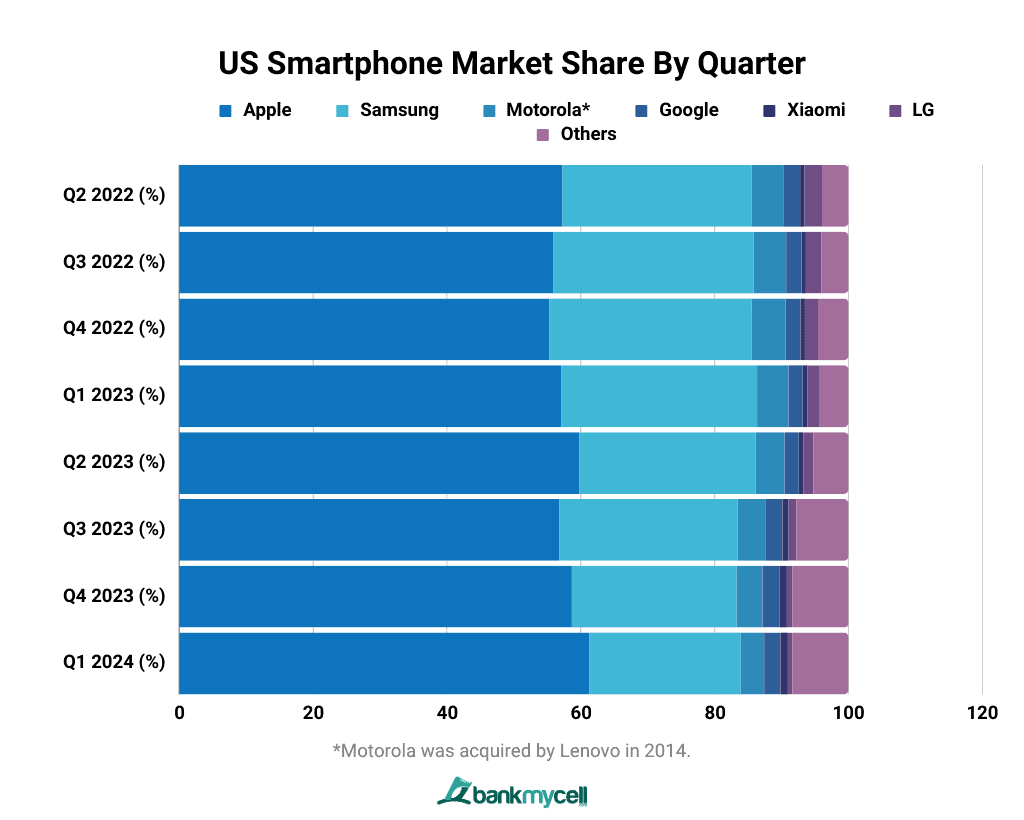
- Data Table
-
Brands Q1 2023 (%) Q2 2023 (%) Q3 2023 (%) Q4 2023 (%) Q1 2024 (%) Apple 57.12 59.79 56.83 58.66 61.26 Samsung 29.21 26.29 26.55 24.59 22.63 Motorola* 4.68 4.34 4.26 3.89 3.5 Google 2.11 2.11 2.48 2.56 2.4 Xiaomi 0.73 0.72 0.91 1.07 1.14 LG 1.74 1.47 1.14 0.87 0.66 Others 4.41 5.27 7.83 8.37 8.41 *Motorola was acquired by Lenovo in 2014.
- Data Graph
-

The first quarter of 2024 shows Apple leading the market share of mobile phones in the US at 61.26%, followed by Samsung at 22.63% brand share. The rest of the phone brands share around 15% of the US smartphone sales revenue.
Data shows that Apple has constantly taken the highest market share and smartphone sales over the last four quarters, taking more than half of the total US market share. Samsung, which takes around a solid quarter of the US market share, also constantly came in second place.
US Market Share by Year (2013-2024)
US Smartphone Market Share by Year from 2013 to 2024 (%)
| Brands | 2013 | 2014 | 2015 | 2016 | 2017 | 2018 | 2019 | 2020 | 2021 | 2022 | 2023 | 2024 |
|---|---|---|---|---|---|---|---|---|---|---|---|---|
| Apple | 52.76 | 52.28 | 50.85 | 53.19 | 53.89 | 54.82 | 55.23 | 59.54 | 58.58 | 56.74 | 58.1 | 61.26 |
| Samsung | 18.38 | 25.34 | 26.57 | 26.79 | 26.62 | 24.76 | 25.67 | 24.72 | 25.64 | 28.94 | 26.89 | 22.63 |
| Motorola* | 4.7 | 3.62 | 3.59 | 3.2 | 3.15 | 3.49 | 3.68 | 3.17 | 3.65 | 4.75 | 4.33 | 3.5 |
| 0.84 | 0.84 | 0.88 | 1.16 | 1.14 | 1.85 | 2.45 | 2.53 | 2.24 | 2.32 | 2.28 | 2.4 | |
| Xiaomi | - | 0.01 | 0.15 | 0.09 | 0.16 | 0.43 | 0.71 | 0.49 | 0.83 | 0.65 | 0.83 | 1.14 |
| LG | 4.09 | 5 | 6.62 | 6.61 | 7.36 | 7.01 | 6.26 | 4.89 | 4.15 | 2.47 | 1.36 | 0.66 |
| OnePlus | - | 0.01 | 0.1 | 0.09 | 0.14 | 0.12 | 0.43 | 0.59 | 0.67 | 0.85 | 0.74 | 0.62 |
| Huawei | 1.28 | 0.74 | 0.54 | 0.62 | 0.69 | 0.92 | 0.97 | 0.99 | 0.83 | 0.34 | 0.29 | 0.36 |
| Vivo | - | - | - | - | - | - | - | 0.02 | 0.23 | 0.19 | 0.23 | 0.29 |
| OPPO | - | - | 0.05 | 0.04 | 0.08 | 0.16 | 0.26 | 0.14 | 0.25 | 0.19 | 0.23 | 0.28 |
| Others | 17.96 | 12.16 | 10.65 | 8.2 | 6.75 | 6.43 | 4.32 | 2.91 | 2.91 | 2.55 | 4.71 | 6.86 |
*Motorola was acquired by Lenovo in 2014.
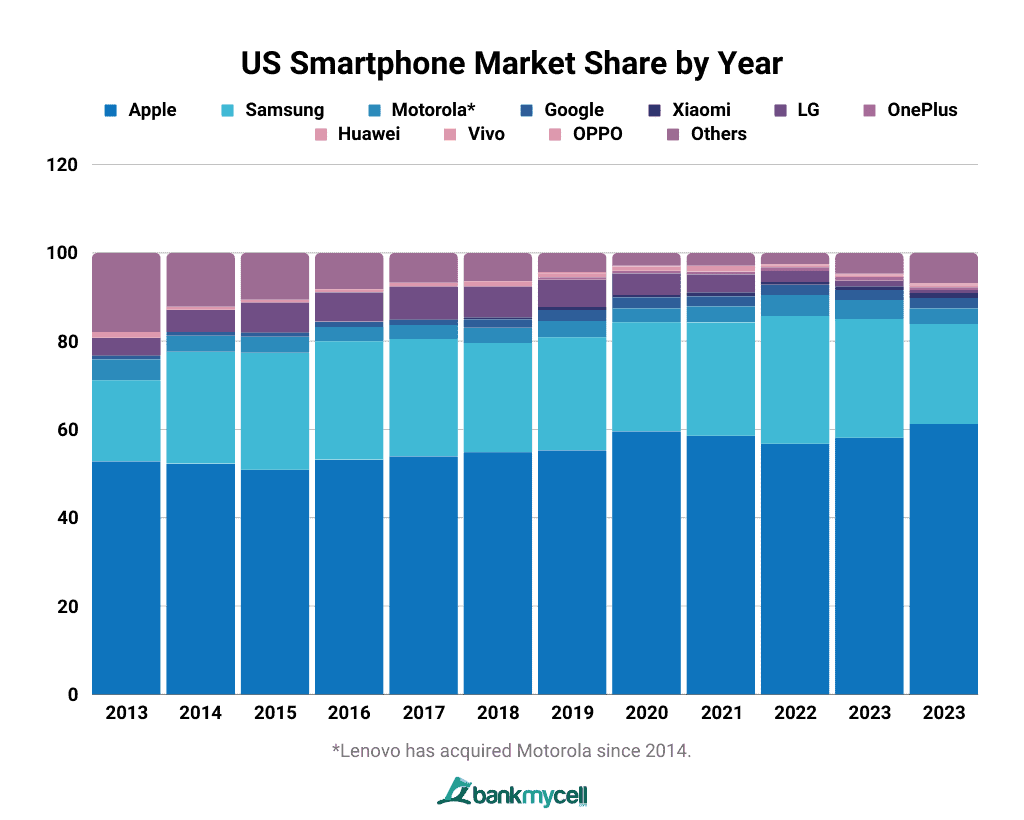
- Data Table
-
Brands 2013 2014 2015 2016 2017 2018 2019 2020 2021 2022 2023 2024 Apple 52.76 52.28 50.85 53.19 53.89 54.82 55.23 59.54 58.58 56.74 58.1 61.26 Samsung 18.38 25.34 26.57 26.79 26.62 24.76 25.67 24.72 25.64 28.94 26.89 22.63 Motorola* 4.7 3.62 3.59 3.2 3.15 3.49 3.68 3.17 3.65 4.75 4.33 3.5 Google 0.84 0.84 0.88 1.16 1.14 1.85 2.45 2.53 2.24 2.32 2.28 2.4 Xiaomi - 0.01 0.15 0.09 0.16 0.43 0.71 0.49 0.83 0.65 0.83 1.14 LG 4.09 5 6.62 6.61 7.36 7.01 6.26 4.89 4.15 2.47 1.36 0.66 OnePlus - 0.01 0.1 0.09 0.14 0.12 0.43 0.59 0.67 0.85 0.74 0.62 Huawei 1.28 0.74 0.54 0.62 0.69 0.92 0.97 0.99 0.83 0.34 0.29 0.36 Vivo - - - - - - - 0.02 0.23 0.19 0.23 0.29 OPPO - - 0.05 0.04 0.08 0.16 0.26 0.14 0.25 0.19 0.23 0.28 Others 17.96 12.16 10.65 8.2 6.75 6.43 4.32 2.91 2.91 2.55 4.71 6.86 *Motorola was acquired by Lenovo in 2014.
- Data Graph
-

Apple Smartphone Market Share Trends
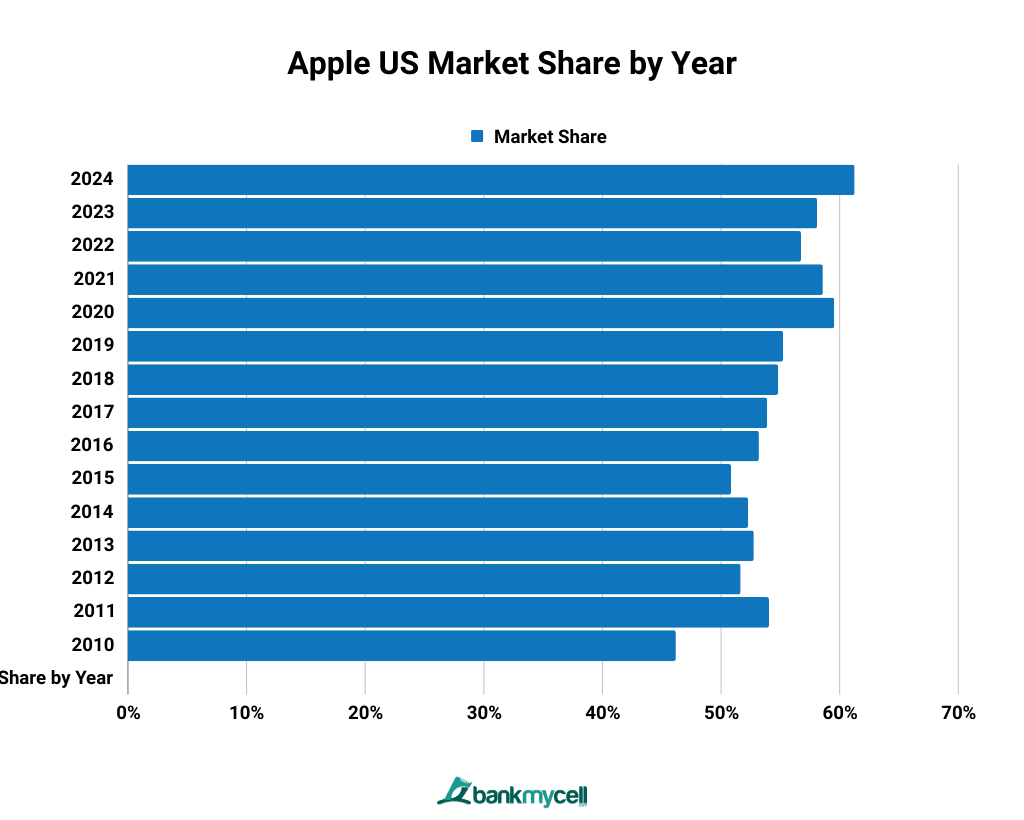
Apple has consistently topped the US smartphone sales with more than 50% market share for years, starting from 2011 up to the present.
It is also worth noting that Android devices took over smartphone sales throughout the US in 2010 before Apple snatched it away in 2011 and continued to dominate the market until the present.
Samsung Smartphone Market Share Trends
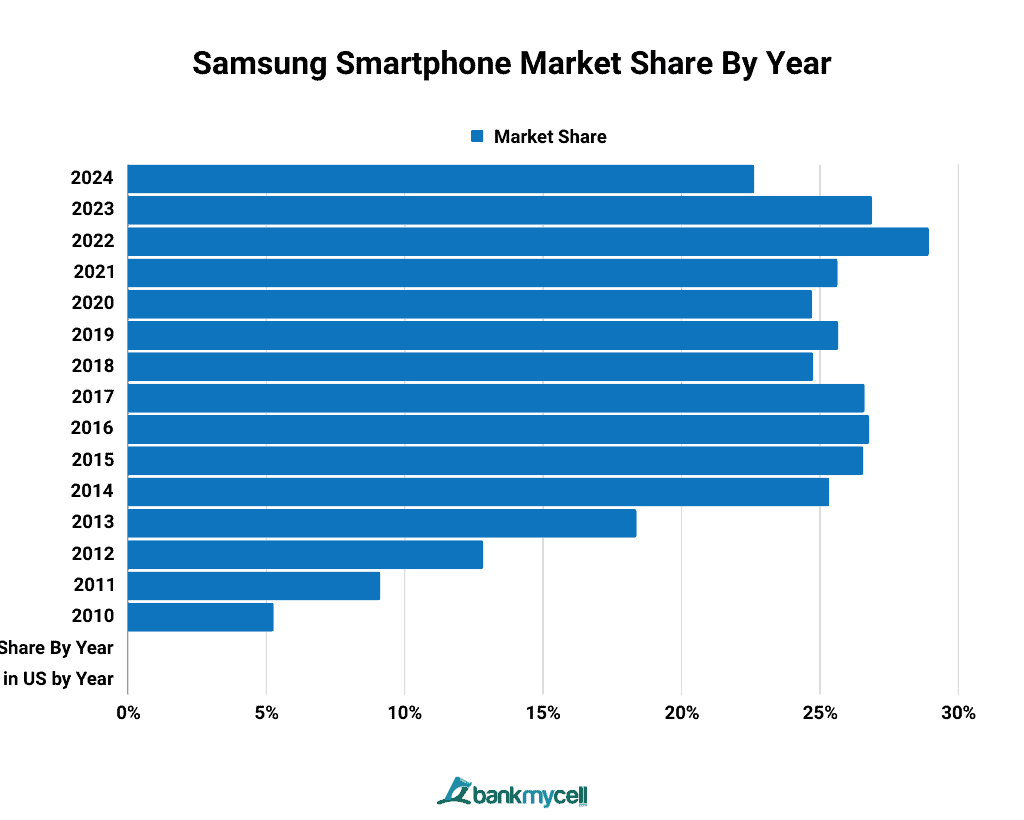
Data shows that Samsung had a rough start in the US. However, they steadily grew and finally captured a quarter of the US market share starting in 2014 when they released the Galaxy S5. Despite the decline of their global market share due to the rise of smartphone companies from China, such as Xiaomi, their US numbers managed to remain relatively steady, playing around 24 to 29%.
Even though the year is not over, Samsung held its highest market share in the US yet in 2022-2023. This might be partly due to their latest smartphone lines, the A and S series, which cover a wide range of price points. From 2010, the company increased its yearly market share by 22.18%.
APPLE
Market Share of Apple in the US
Apple’s market share for this month is currently at 61.26%, taking the biggest chunk of the smartphone market share in the US. However, it is a 0.74% decline from the peak monthly market share of the brand in 2023 at 62.00% market share. Apple still has a significant lead over its competitor, Samsung, with a 38.63% difference in market share this month.
Apple Market Share in the US (By Quarter)
iPhone Market Share by Quarter
| Quarter | Market Share |
|---|---|
| Q1 2024 | 61.26% |
| Q4 2023 | 58.66% |
| Q3 2023 | 56.83% |
| Q2 2023 | 57.79% |
| Q1 2023 | 57.12% |
| Q4 2022 | 55.31% |
| Q3 2022 | 55.91% |
| Q2 2022 | 57.23% |
| Q1 2022 | 58.50% |
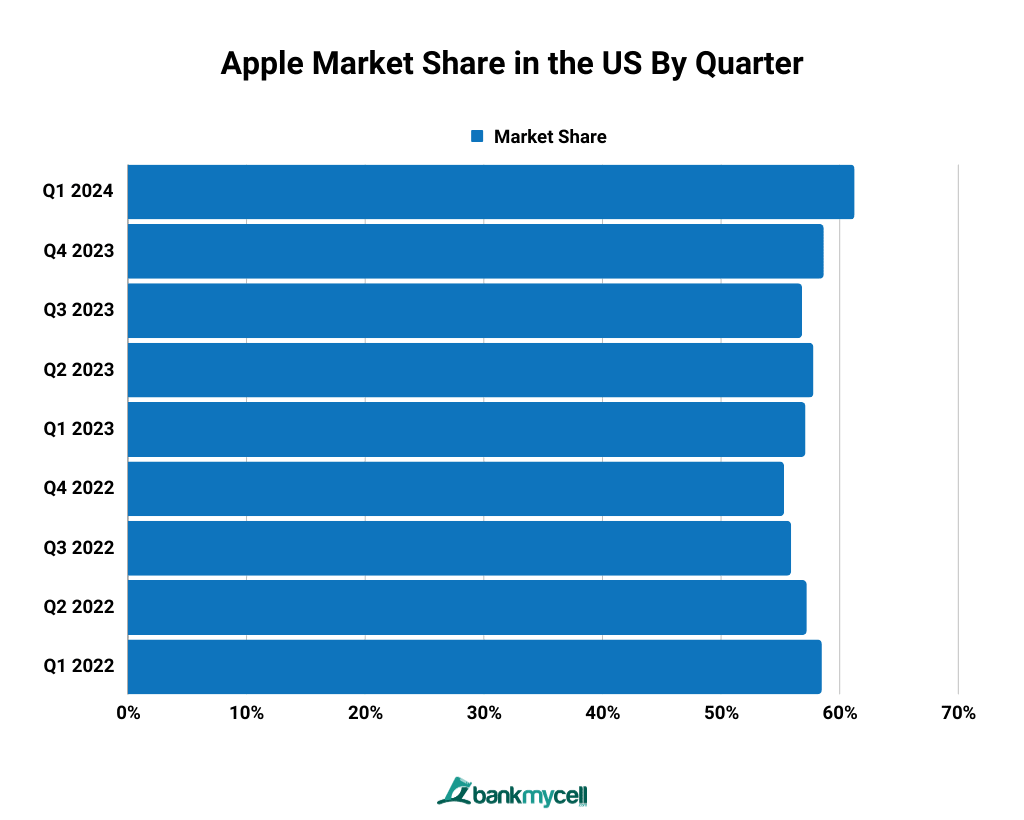
- Data Table
-
iPhone Market Share by Quarter
Quarter Market Share Q1 2024 61.26% Q4 2023 58.66% Q3 2023 56.83% Q2 2023 57.79% Q1 2023 57.12% Q4 2022 55.31% Q3 2022 55.91% Q2 2022 57.23% Q1 2022 58.50% - Data Graph
-

Key Stats:
- America is the most significant Apple market, accounting for 37.47 billion US dollars in net sales during the third quarter of the company’s fiscal year 2022.
- America has around 120 million iPhone users in 2022-2023, accounting for 57% of all smartphone users in the country.
- According to Counterpoint Research, Apple managed to become the top smartphone vendor in the world recently, easing out Samsung from its position.
Apple’s market share for the first quarter of 2024 is at 61.26%. This is a 2.60% increase in its market share compared to Q4 2023. The company continues to take more than half of the total smartphone sales in the country.
The first quarter of 2022 showed a slight increase owing to high demand for the iPhone 13 in the premium segment and the launch of the iPhone SE, providing a budget-friendly option to iOS users. Data shows a slight decline starting from the second quarter of 2022 after that.
Apple US Market Share by Year (2010-2024)
| Year | Market Share |
|---|---|
| 2024 | 61.26% |
| 2023 | 58.10% |
| 2022 | 56.74% |
| 2021 | 58.58% |
| 2020 | 59.54% |
| 2019 | 55.23% |
| 2018 | 54.82% |
| 2017 | 53.89% |
| 2016 | 53.19% |
| 2015 | 50.85% |
| 2014 | 52.28% |
| 2013 | 52.76% |
| 2012 | 51.65% |
| 2011 | 54.04% |
| 2010 | 46.19% |
- Data Table
-
Year Market Share 2024 61.26% 2023 58.10% 2022 56.74% 2021 58.58% 2020 59.54% 2019 55.23% 2018 54.82% 2017 53.89% 2016 53.19% 2015 50.85% 2014 52.28% 2013 52.76% 2012 51.65% 2011 54.04% 2010 46.19% - Data Graph
-

For the year 2024, Apple’s market share in the US is at 61.26%. This is a 3.16% increase compared to 2023. There are currently 120 million iPhone users in the country.
Key Stats:
- Apple achieved its major breakthrough in the US market in 2011 when it reached more than 50% market share for the first time. They broke sales records and earned the top spot, besting all the Android-based original equipment manufacturers (OEMs) combined. Over the years, Apple has continued to dominate the market share in America with its premium-segment devices.
- Apple had a market share of less than 50% in the previous years before 2011, as the companies RIM (maker of BlackBerry), Motorola, and Nokia dominated smartphone sales.
- Apple’s largest market share to date was in the year 2020, taking 59.54% in America despite the COVID-19 pandemic. Apple continues to be the most valuable technology company in market capitalization this year.
SAMSUNG
Market Share of Samsung in the US
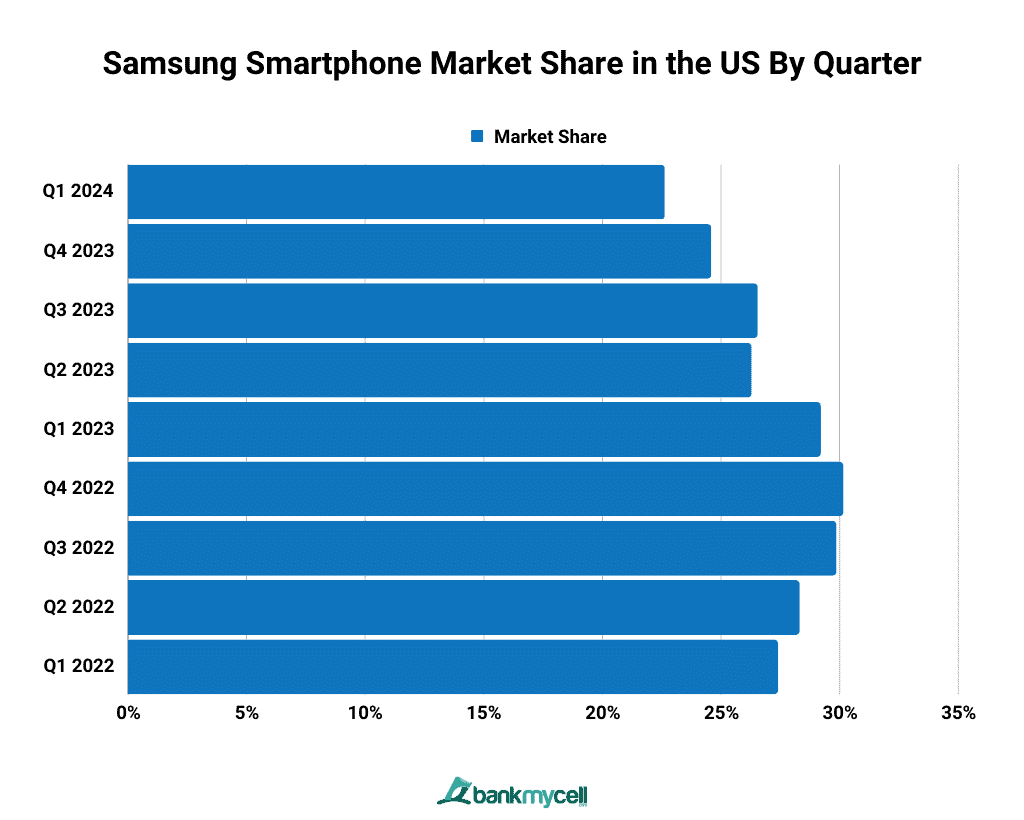
Samsung’s market share for this month is at 22.63%, a 6.84% decline from 2023’s peak monthly market share of 29.47%. They hold the second largest market share in America, 38.63% behind Apple, which has a market share of 61.26% in the same month.
Samsung Smartphone Market Share in the US (By Quarter)
Market Share of Samsung in the US by Quarter
| Quarter | Market Share |
|---|---|
| Q1 2024 | 22.63% |
| Q4 2023 | 24.59% |
| Q3 2023 | 26.65% |
| Q2 2023 | 26.29% |
| Q1 2023 | 29.21% |
| Q4 2022 | 30.16% |
| Q3 2022 | 29.87% |
| Q2 2022 | 28.32% |
| Q1 2022 | 27.41% |
- Data Table
-
Market Share of Samsung in the US by Quarter
Quarter Market Share Q1 2024 22.63% Q4 2023 24.59% Q3 2023 26.65% Q2 2023 26.29% Q1 2023 29.21% Q4 2022 30.16% Q3 2022 29.87% Q2 2022 28.32% Q1 2022 27.41% - Data Graph
-

The second largest quarterly market share of smartphones in the US as of Q1 2024 is held by Samsung at 22.63%. Data shows that the company’s market share declined by 1.96% compared to the fourth quarter of 2023.
Samsung Smartphone Market Share By Year (2010-2024)
Samsung US Market Share by Year (2010-2023)
| Year | Market Share |
|---|---|
| 2024 | 22.63% |
| 2023 | 26.89% |
| 2022 | 28.94% |
| 2021 | 25.64% |
| 2020 | 24.72% |
| 2019 | 25.67% |
| 2018 | 24.76% |
| 2017 | 26.62% |
| 2016 | 26.79% |
| 2015 | 26.57% |
| 2014 | 25.34% |
| 2013 | 18.38% |
| 2012 | 12.84% |
| 2011 | 9.12% |
| 2010 | 5.27% |
- Data Table
-
Samsung US Market Share by Year (2010-2023)
Year Market Share 2024 22.63% 2023 26.89% 2022 28.94% 2021 25.64% 2020 24.72% 2019 25.67% 2018 24.76% 2017 26.62% 2016 26.79% 2015 26.57% 2014 25.34% 2013 18.38% 2012 12.84% 2011 9.12% 2010 5.27% - Data Graph
-

Samsung’s market share for the year 2024 is 22.63%. Over the years, Samsung has boosted its market share in the US by more than five times since releasing its first Samsung Galaxy in 2009. From 5.27% market share in 2010 to 26.89% in 2023. The company has maintained the second-largest share in the US from 2012 to the present and has continued to grow in recent years.
SAMSUNG VS APPLE
Samsung vs. Apple Market Share in the US
Apple and Samsung currently hold the largest market share in the US, with a combined market share of 83.57% this month. Apple leads with 57.10%, and Samsung is second with 26.47%. The staggering 26.47% difference shows a strong demand for Apple products and the iPhone series by consumers in the US. Maintaining shares at around 55%, Apple has bested all Android OEMs in America.
Samsung vs. iPhone Market Share in the US (By Quarter)
| Quarter | Apple | Samsung |
|---|---|---|
| Q1 2024 | 61.26% | 22.63% |
| Q4 2023 | 58.66% | 24.59% |
| Q3 2023 | 58.83% | 26.65% |
| Q2 2023 | 59.79% | 26.29% |
| Q1 2023 | 57.12% | 29.21% |
| Q4 2022 | 55.31% | 30.16% |
| Q3 2022 | 55.91% | 29.87% |
| Q2 2022 | 57.23% | 28.32% |
- Data Table
-
Quarter Apple Samsung Q1 2024 61.26% 22.63% Q4 2023 58.66% 24.59% Q3 2023 58.83% 26.65% Q2 2023 59.79% 26.29% Q1 2023 57.12% 29.21% Q4 2022 55.31% 30.16% Q3 2022 55.91% 29.87% Q2 2022 57.23% 28.32% - Data Graph
-

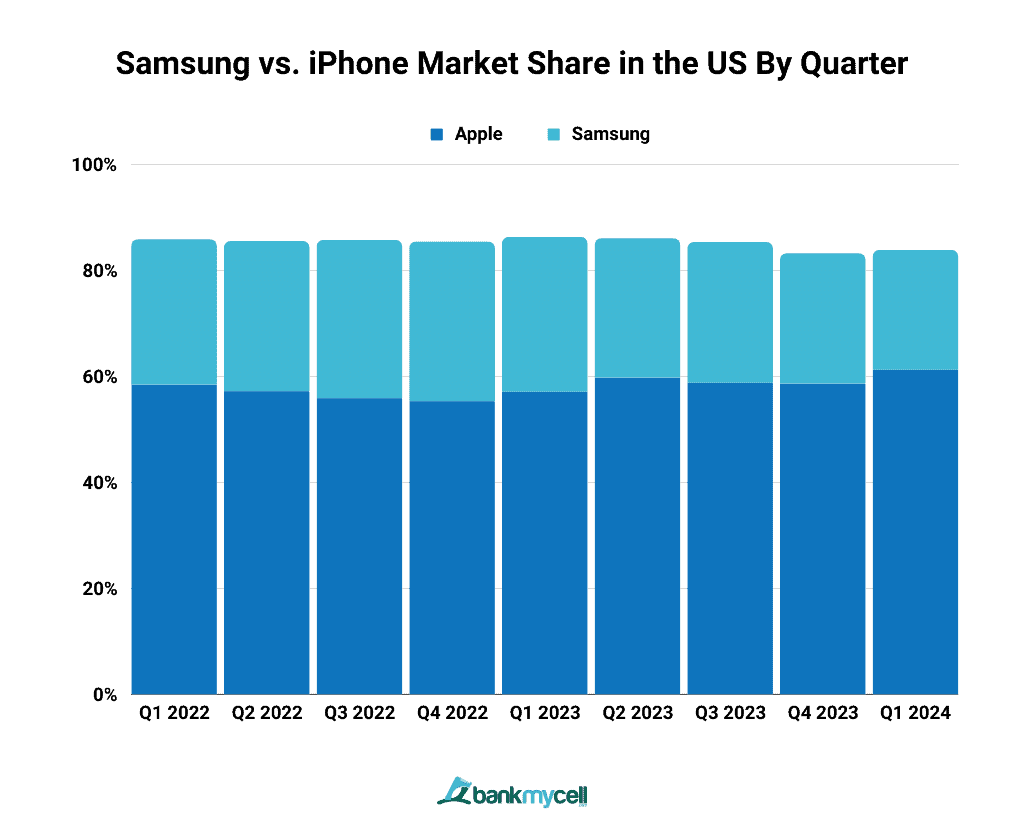
The first quarter of the US smartphone market share in 2024 saw Apple at 61.26% and Samsung at 22.63%. Despite the marginal difference between the two vendors in the global market share, the US market shows a massive difference of 38.63% in Apple’s favor.
Apple has maintained a solid lead in US smartphone sales over the last quarters. Apple’s market share has increased by 2.60% compared to last year’s fourth quarter. In contrast, Samsung has dropped by 1.96% compared to Q4 2023.
Samsung increased the production of their well-known A series to compete in the mid-to-low-end segment. The company is also refreshing its 2023 portfolio, which includes the flagship Galaxy S23 series.
MOTOROLA
Motorola Market Share in the US
Motorola currently has a monthly market share of 4.16%, placing Motorola third in rank in the US market. Motorola was acquired by Lenovo in 2014.
Motorola Smartphone Market Share in the US (By Quarter)
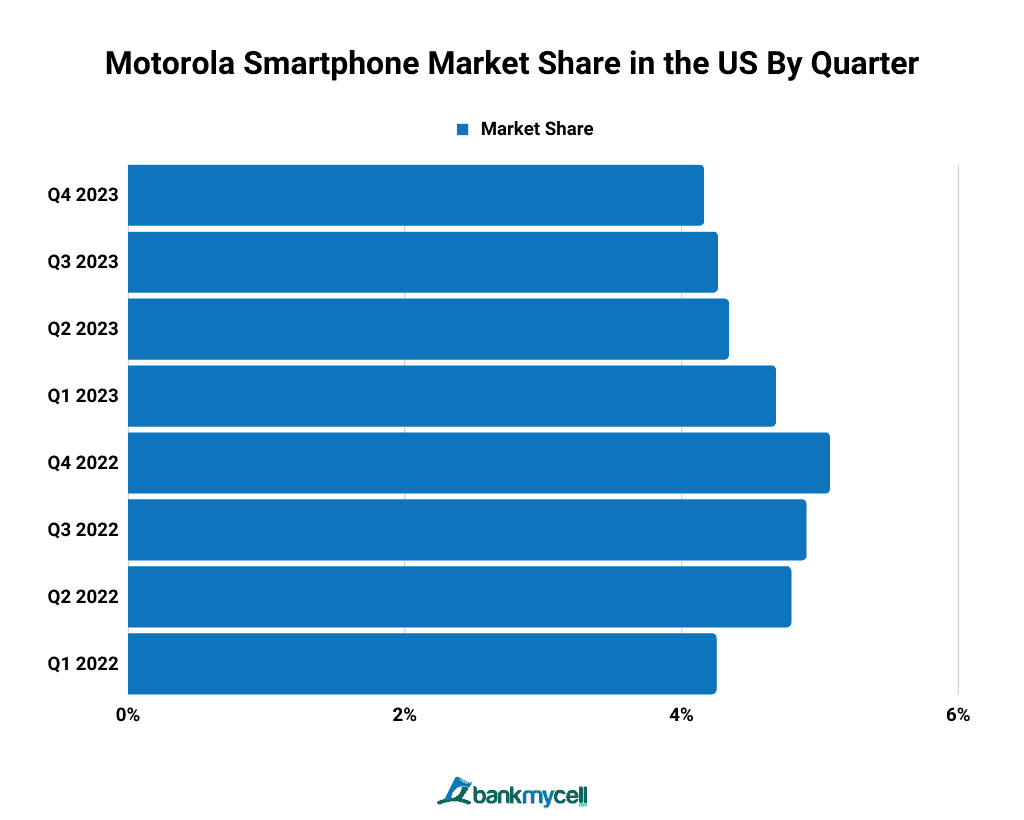
Market Share of Motorola in the US by Quarter
| Quarter | Market Share |
|---|---|
| Q1 2024 | 3.50% |
| Q4 2023 | 3.89% |
| Q3 2023 | 4.26% |
| Q2 2023 | 4.34% |
| Q1 2023 | 4.68% |
| Q4 2022 | 5.07% |
| Q3 2022 | 4.90% |
| Q2 2022 | 4.79% |
| Q1 2022 | 4.25% |
*Motorola was acquired by Lenovo in 2014.
- Data Table
-
Market Share of Motorola in the US by Quarter
Quarter Market Share Q1 2024 3.50% Q4 2023 3.89% Q3 2023 4.26% Q2 2023 4.34% Q1 2023 4.68% Q4 2022 5.07% Q3 2022 4.90% Q2 2022 4.79% Q1 2022 4.25% *Motorola was acquired by Lenovo in 2014.
- Data Graph
-

Motorola’s current quarterly market share is at 3.50%. This is a decline of 0.39% compared to the brand’s market share during the fourth quarter of 2023.
Motorola Market Share By Year in the US (2010-2024)
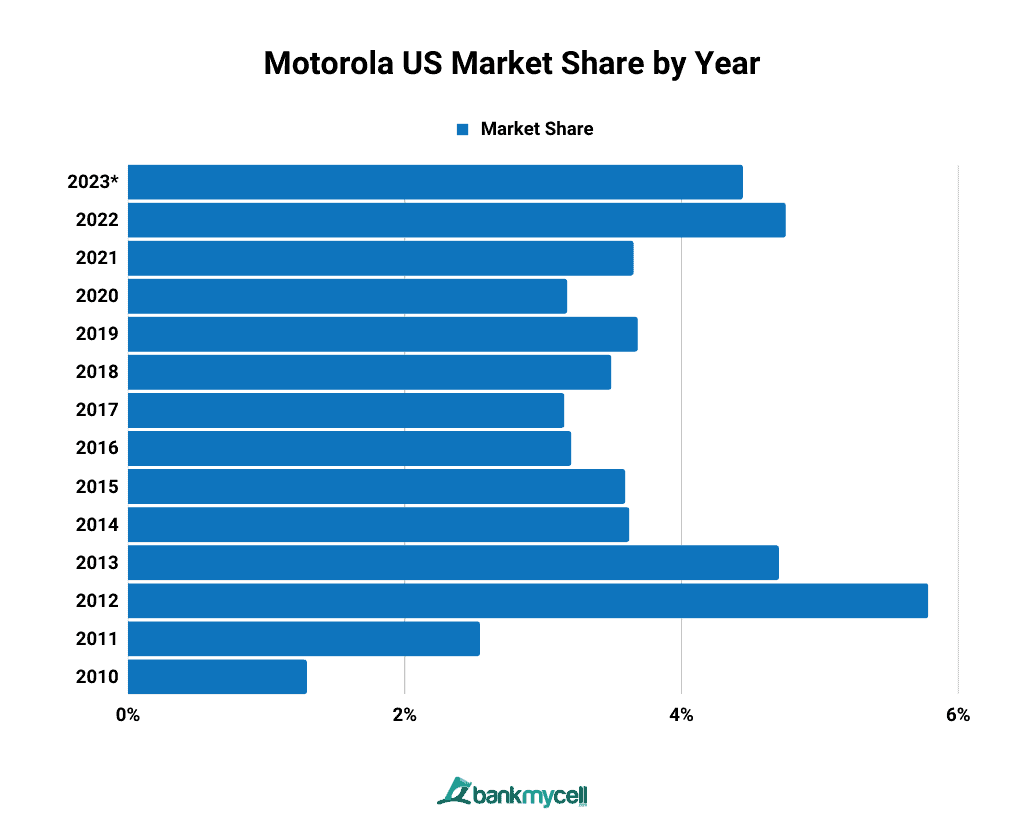
Motorola US Market Share by Year
| Year | Market Share |
|---|---|
| 2024 | 3.50% |
| 2023 | 4.33% |
| 2022 | 4.75% |
| 2021 | 3.65% |
| 2020 | 3.17% |
| 2019 | 3.68% |
| 2018 | 3.49% |
| 2017 | 3.15% |
| 2016 | 3.20% |
| 2015 | 3.59% |
| 2014 | 3.62% |
| 2013 | 4.70% |
| 2012 | 5.78% |
| 2011 | 2.54% |
| 2010 | 1.29% |
*Motorola was acquired by Lenovo in 2014.
- Data Table
-
Motorola US Market Share by Year
Year Market Share 2024 3.50% 2023 4.33% 2022 4.75% 2021 3.65% 2020 3.17% 2019 3.68% 2018 3.49% 2017 3.15% 2016 3.20% 2015 3.59% 2014 3.62% 2013 4.70% 2012 5.78% 2011 2.54% 2010 1.29% *Motorola was acquired by Lenovo in 2014.
- Data Graph
-

The above data shows the yearly smartphone market share of Motorola in the US over the years. Motorola currently has a 3.50% market share in 2024, a slight decline of 0.83% from the previous year. The brand has managed to keep a stable 3-5% market share through the years.
GOOGLE PIXEL
Google Market Share in the US
This month, Google ranks fourth in the US smartphone market share with 2.40%, trailing behind Motorola. They have increased significantly over the previous months with the help of their newest Pixel.
Google Smartphone Market Share in the US (By Quarter)
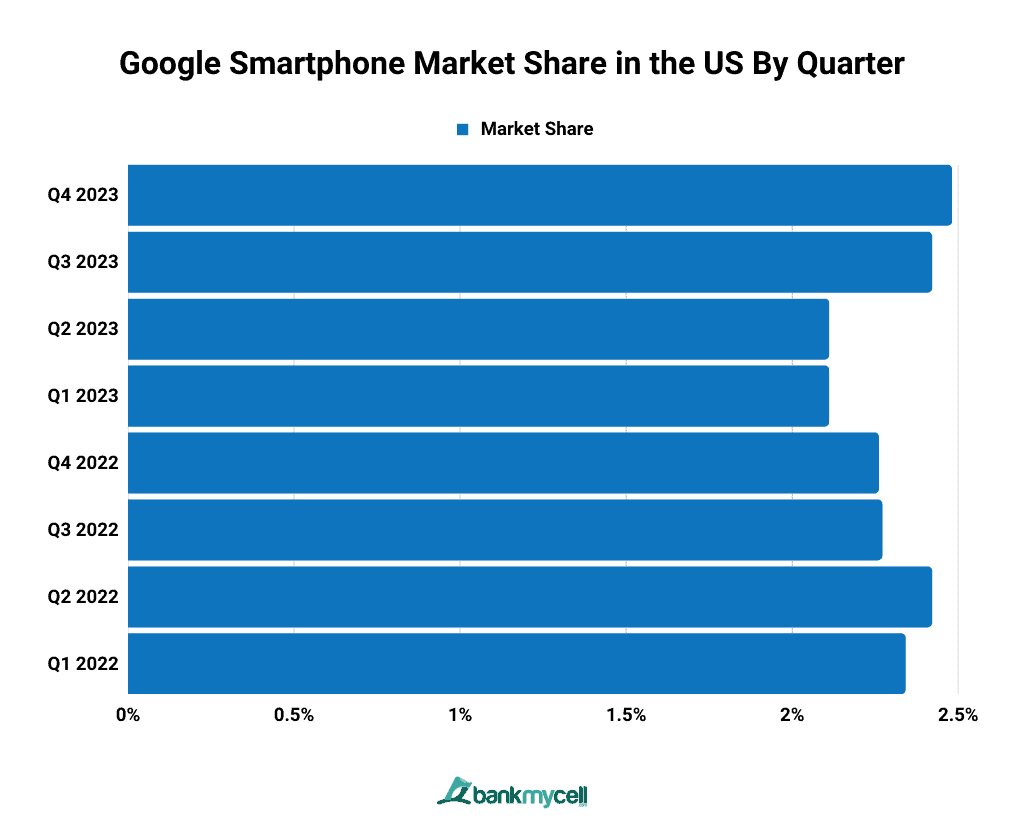
Google US Market Share by Quarter
| Quarter | Market Share |
|---|---|
| Q1 2024 | 2.40% |
| Q4 2023 | 2.56% |
| Q3 2023 | 2.42% |
| Q2 2023 | 2.11% |
| Q1 2023 | 2.11% |
| Q4 2022 | 2.26% |
| Q3 2022 | 2.27% |
| Q2 2022 | 2.42% |
| Q1 2022 | 2.34% |
- Data Table
-
Google US Market Share by Quarter
Quarter Market Share Q1 2024 2.40% Q4 2023 2.56% Q3 2023 2.42% Q2 2023 2.11% Q1 2023 2.11% Q4 2022 2.26% Q3 2022 2.27% Q2 2022 2.42% Q1 2022 2.34% - Data Graph
-

Google’s smartphone market share for Q1 2024 is at 2.40%. This is a decline of 0.16% compared to the fourth quarter of 2023. Up until the third quarter of 2022, LG held the fourth rank in terms of market share in the US. The brand’s steady decline in the most recent quarters, however, allowed Google to take the spot.
Google Pixel Market Share By Year (2010-2024)
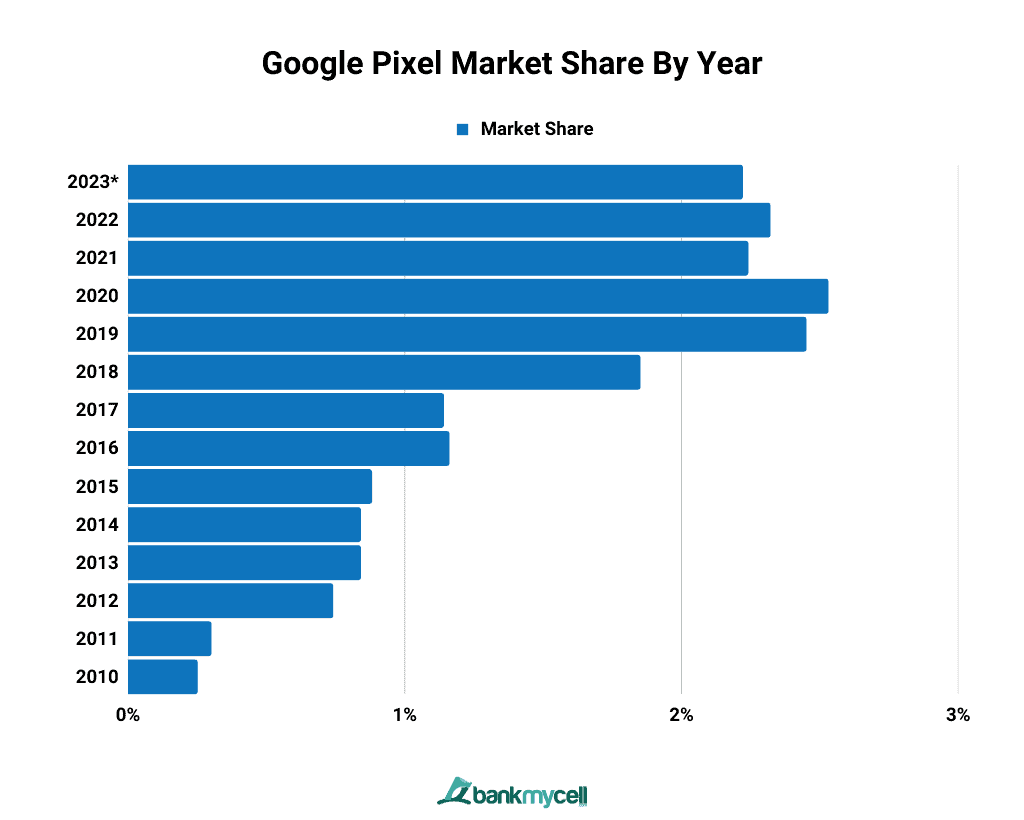
Google Pixel US Market Share by Year
| Year | Market Share |
|---|---|
| 2024 | 2.40% |
| 2023 | 2.28% |
| 2022 | 2.32% |
| 2021 | 2.24% |
| 2020 | 2.53% |
| 2019 | 2.45% |
| 2018 | 1.85% |
| 2017 | 1.14% |
| 2016 | 1.16% |
| 2015 | 0.88% |
| 2014 | 0.84% |
| 2013 | 0.84% |
| 2012 | 0.74% |
| 2011 | 0.30% |
| 2010 | 0.25% |
- Data Table
-
Google Pixel US Market Share by Year
Year Market Share 2024 2.40% 2023 2.28% 2022 2.32% 2021 2.24% 2020 2.53% 2019 2.45% 2018 1.85% 2017 1.14% 2016 1.16% 2015 0.88% 2014 0.84% 2013 0.84% 2012 0.74% 2011 0.30% 2010 0.25% - Data Graph
-

Google currently has a yearly market share of 2.40%. The brand gradually entered the market with a market share ranging from 0.25% to 1.85% from 2010 to 2018. With the release of the Pixel 3 series in 2019, it rose to 2.45%, landing Google fifth place in the US market from 2019 to 2022.
LG
LG Market Share in the US
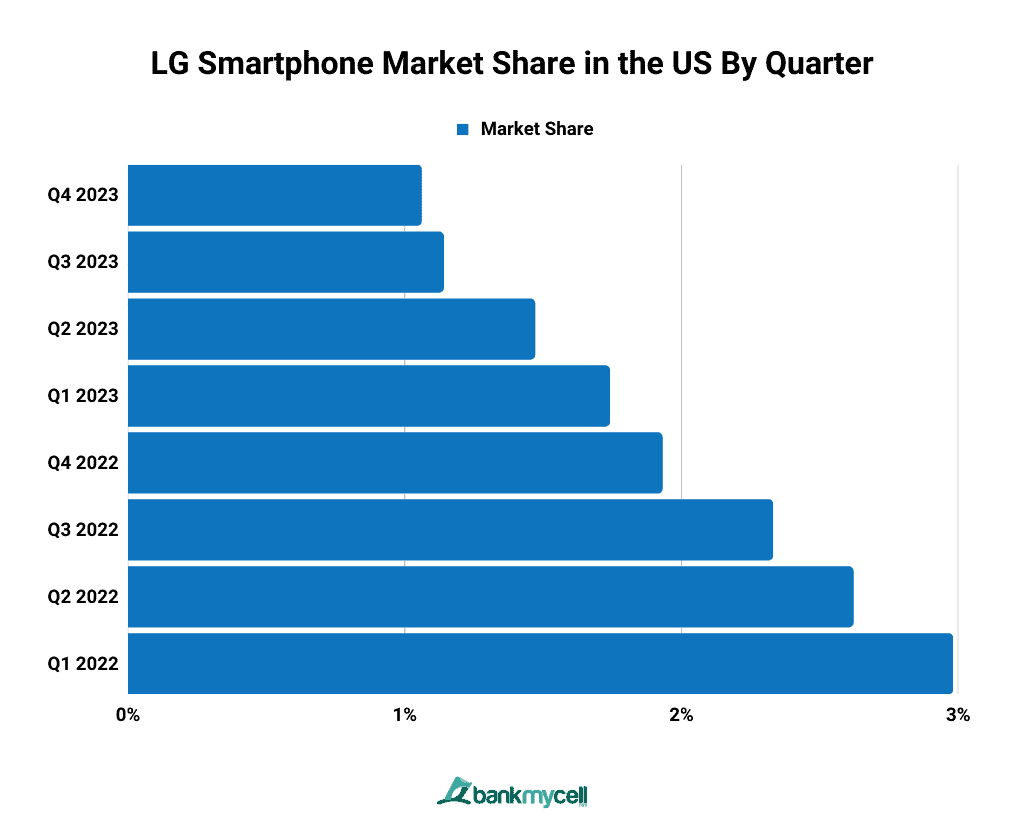
LG’s market share is currently at 0.66%, showing a decrease of 1.02% from its highest monthly market share in 2023 at 1.68%. The company stopped making smartphones in 2021 and its market share in the US market has been constantly declining.
LG Smartphone Market Share in the US (By Quarter)
LG US Market Share by Quarter
| Quarter | Market Share |
|---|---|
| Q1 2024 | 0.66% |
| Q4 2023 | 0.87% |
| Q3 2023 | 1.14% |
| Q2 2023 | 1.47% |
| Q1 2023 | 1.74% |
| Q4 2022 | 1.93% |
| Q3 2022 | 2.33% |
| Q2 2022 | 2.62% |
| Q1 2022 | 2.98% |
- Data Table
-
LG US Market Share by Quarter
Quarter Market Share Q1 2024 0.66% Q4 2023 0.87% Q3 2023 1.14% Q2 2023 1.47% Q1 2023 1.74% Q4 2022 1.93% Q3 2022 2.33% Q2 2022 2.62% Q1 2022 2.98% - Data Graph
-

LG’s current quarterly market share at 0.66% is a 0.21% decline from its brand share from the fourth quarter of 2023. The brand’s most recent quarters have been showing a downward trend in the US market following the termination of its phone manufacturing business.
LG Market Share By Year in the US (2015-2024)
LG US Market Share by Year
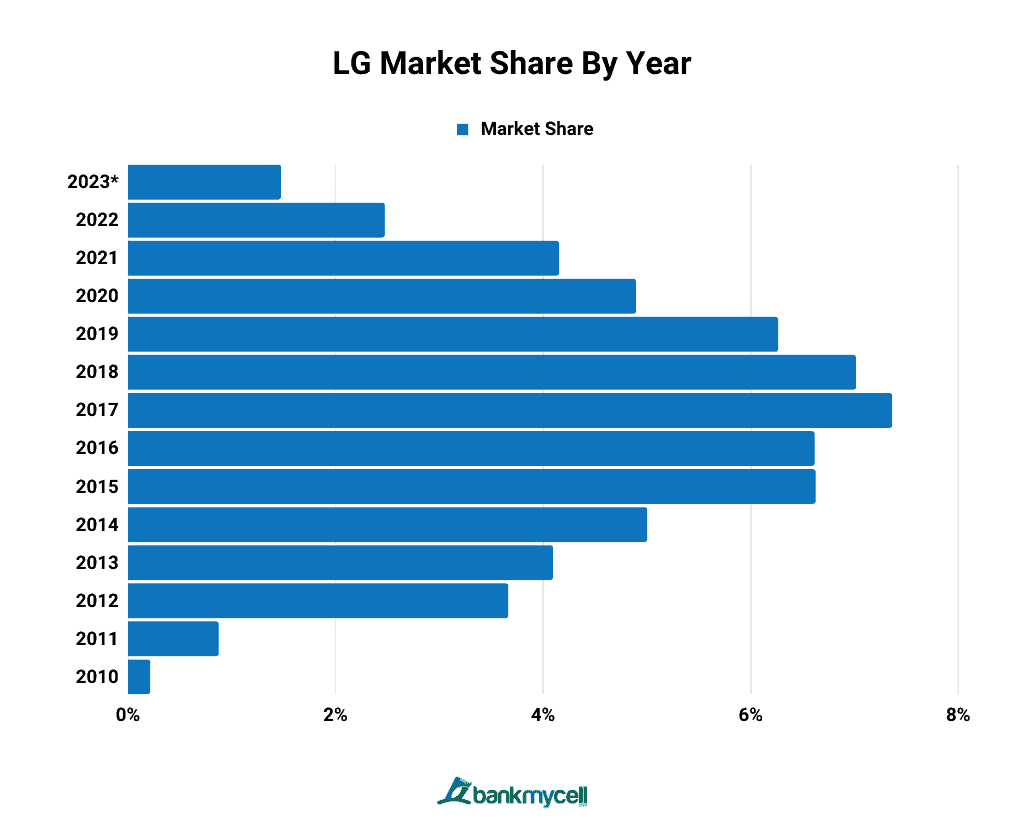
| Year | Market Share |
|---|---|
| 2024 | 0.66% |
| 2023 | 1.36% |
| 2022 | 2.47% |
| 2021 | 4.15% |
| 2020 | 4.89% |
| 2019 | 6.26% |
| 2018 | 7.01% |
| 2017 | 7.36% |
| 2016 | 6.61% |
| 2015 | 6.62% |
| 2014 | 5.00% |
| 2013 | 4.09% |
| 2012 | 3.66% |
| 2011 | 0.87% |
| 2010 | 0.21% |
- Data Table
-
LG US Market Share by Year
Year Market Share 2024 0.66% 2023 1.36% 2022 2.47% 2021 4.15% 2020 4.89% 2019 6.26% 2018 7.01% 2017 7.36% 2016 6.61% 2015 6.62% 2014 5.00% 2013 4.09% 2012 3.66% 2011 0.87% 2010 0.21% - Data Graph
-

LG’s dwindling market share is down to 0.66% in 2024. From a mere 0.21% market share in the US in 2010, they peaked at 7.36% in 2017. Their growth was bolstered by a diverse portfolio of product devices. Following years, however, of a dwindling market share, the company decided to discontinue its phone lines in 2021.