Smartphone Market Share in China (2026)


Learn about the most popular smartphone brands in China and how they compete in terms of monthly, quarterly, and yearly market shares.
Discover how Apple, a non-Chinese company, is thriving in the market, and how Huawei, a Chinese company that had ongoing US sanctions, is dominating the Chinese market in terms of market shares, among other things.
We gathered data from credible sources to determine how brands rank in terms of market shares in the Chinese smartphone market.
Most Popular Phone Brands in China (Most Recent Quarter)
| Brand | Market Share |
|---|---|
| Apple | 24.74% |
| Huawei | 22.68% |
| Xiaomi | 12.96% |
| Vivo | 5.70% |
| OPPO | 4.48% |
| 2.09% | |
| Honor | 1.55% |
| Others | 25.76% |
The market share of mobile phones in China in the first quarter of 2024 is led by Apple, which is at 24.74%. It is followed by Huawei with 22.68%. Next to them are Xiaomi, Vivo, and OPPO, with market shares at 12.96%, 5.70%, and 4.48%, respectively. Except for Apple, the top 5 brands in China are Chinese-owned companies.
Editors Picks:
- Apple by Market Share: Apple claimed a 24.74% brand share in 2024, a 2.23% decline from the fourth quarter of 2023. Even if it’s not a local China smartphone vendor, Apple remained in the top two for the highest market share for smartphones in the country in 2024. It gained the top spot in the country starting in 2023 starting from Q2 after trailing behind Huawei in the second spot for the past three years.
- Huawei by Market Share: Huawei is China’s second leading smartphone vendor by market share, with 22.68% of the quarterly market share in 2024. This is a decline of 0.17% compared to its brand share in Q4 2023. Huawei had an almost 40% market share in China in early 2021.
- Vivo by Market Share: Vivo ranked fourth in the Chinese market, with a 5.70% quarterly market share in 2024. This is a slight decline of 0.29% this quarter compared to the fourth quarter of 2023.
- OPPO by Market Share: In 2024, OPPO had a 4.48% market share of China’s smartphone market, a 0.18% decrease from Q4 2023. OPPO ranks fifth by highest brand share in China.
- Honor by Market Share: According to StatCounter, Honor had a 1.55% quarterly market share in 2024,, placing it 7th among other smartphone brands in China.
- Xiaomi by Market Share: Xiaomi’s 2024 market share of 12.96% places it third among smartphone vendors in China with the highest market share. This is a 1.51% increase compared to the vendor’s market penetration rate in the fourth quarter of 2023.
- Market Share of Smartphone Vendors in China: In 2024, Apple led the pack with a current quarterly market share of 24.74%, followed by Huawei at 22.68%, Xiaomi at 12.96%, Vivo at 5.70%, and OPPO at 4.48%. Starting from Q2 2023, Apple has managed to take back its lead in China’s mobile market share from Huawei. Apple held the highest market share in the country from 2012 to 2019 before Huawei overtook the position from Q1 2020 to Q1 2023.
In this Article:
- China Smartphone Market Share (Monthly & Quarterly)
- China Smartphone Market Share (Yearly)
- Apple – China Smartphone Market Data
- Huawei – China Smartphone Market Data
- Vivo – China Smartphone Market Data
- Oppo – China Smartphone Market Data
- Honor – China Smartphone Market Data
- Xiaomi – China Smartphone Market Data
Market Share of Phones in China
Market Share of Phones in China (This Month)
| Brands | Market Share |
|---|---|
| Apple | 24.74 |
| Huawei | 22.68 |
| Xiaomi | 12.96 |
| Vivo | 5.7 |
| OPPO | 4.48 |
| 2.09 | |
| Samsung | 1.55 |
| Others | 25.76 |
- Data Table
-
Brands Market Share Apple 24.74 Huawei 22.68 Xiaomi 12.96 Vivo 5.7 OPPO 4.48 Google 2.09 Samsung 1.55 Others 25.76 - Data Graph
-

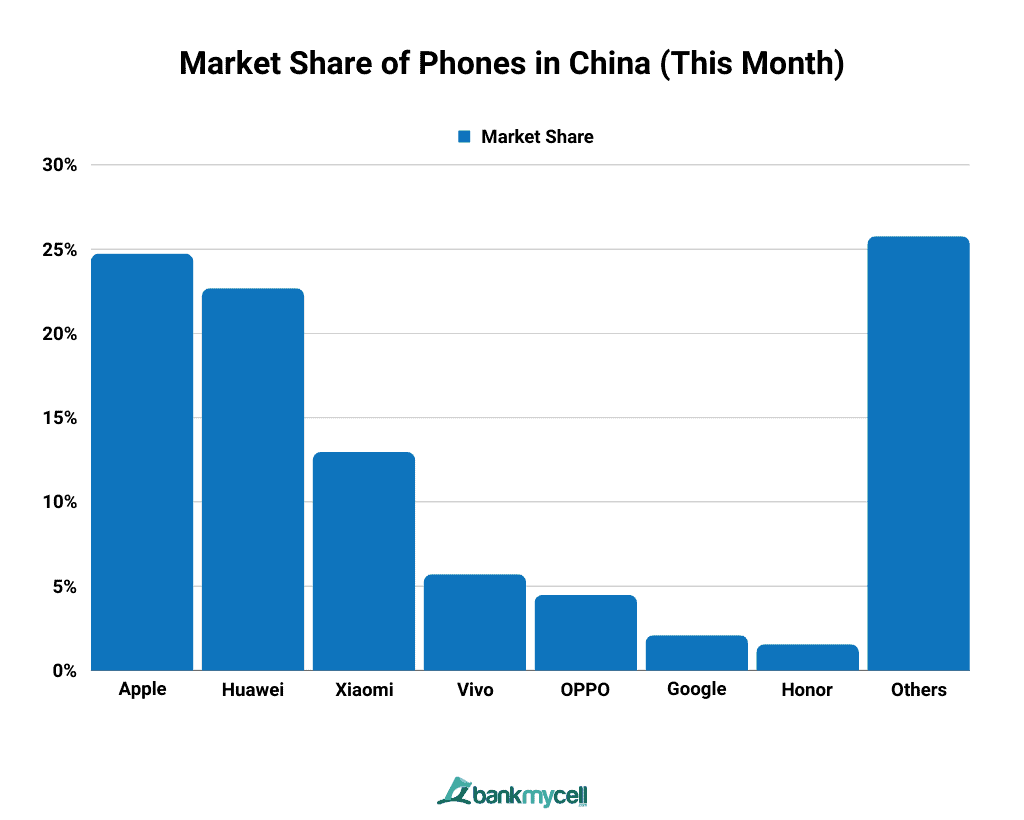
In the most recent month, the current brand with the most market share is Apple at 24.74%, followed in second place by Huawei at 22.68%. Ranking next to these brands are Xiaomi, Vivo, and OPPO, with market shares of 12.96%, 5.70%, and 4.48%, respectively.
Key Stats:
- The number of 5G smartphone shipments in China reached 14.7 million units in July 2022, accounting for more than 73% of total smartphone sales. During that period, the Chinese market saw the release of nine new 5G-capable devices.
- According to Senior Analyst Ivan Lam, Apple and Huawei have long competed for first and second place in terms of market share in China, but other major Chinese OEMs have now begun to target the premium segment.
- Ongoing component shortages since 2021 affect all OEM’s smartphone shipments, and China’s average smartphone replacement cycle is taking longer.
China Smartphone Market Share (Quarterly)
| Brands | Q1 2022 | Q2 2022 | Q3 2022 | Q4 2022 | Q2 2023 | Q3 2023 | Q4 2023 | Q1 2024 |
|---|---|---|---|---|---|---|---|---|
| Apple | 20.52% | 22.78% | 26.35% | 27.19% | 23.19% | 27.83% | 23.09 | 22.51 |
| Huawei | 33.46% | 30.11% | 27.30% | 25.21% | 25.31% | 22.69% | 23.03 | 22.85 |
| Xiaomi | 9.55% | 11.62% | 9.87% | 9.43% | 8.09% | 8.88% | 8.46 | 11.45 |
| Vivo | 7.05% | 6.75% | 6.98% | 5.96% | 7.60% | 6.26% | 6.24 | 5.99 |
| OPPO | 6.44% | 5.84% | 5.80% | 5.53% | 5.33% | 5.06% | 4.81 | 4.66 |
| Others | 23 | 22.89 | 23.69 | 26.66 | 30.47 | 29.26 | 34.36 | 32.51 |
- Data Table
-
Brands Q1 2022 Q2 2022 Q3 2022 Q4 2022 Q2 2023 Q3 2023 Q4 2023 Q1 2024 Apple 20.52% 22.78% 26.35% 27.19% 23.19% 27.83% 23.09 22.51 Huawei 33.46% 30.11% 27.30% 25.21% 25.31% 22.69% 23.03 22.85 Xiaomi 9.55% 11.62% 9.87% 9.43% 8.09% 8.88% 8.46 11.45 Vivo 7.05% 6.75% 6.98% 5.96% 7.60% 6.26% 6.24 5.99 OPPO 6.44% 5.84% 5.80% 5.53% 5.33% 5.06% 4.81 4.66 Others 23 22.89 23.69 26.66 30.47 29.26 34.36 32.51 - Data Graph
-

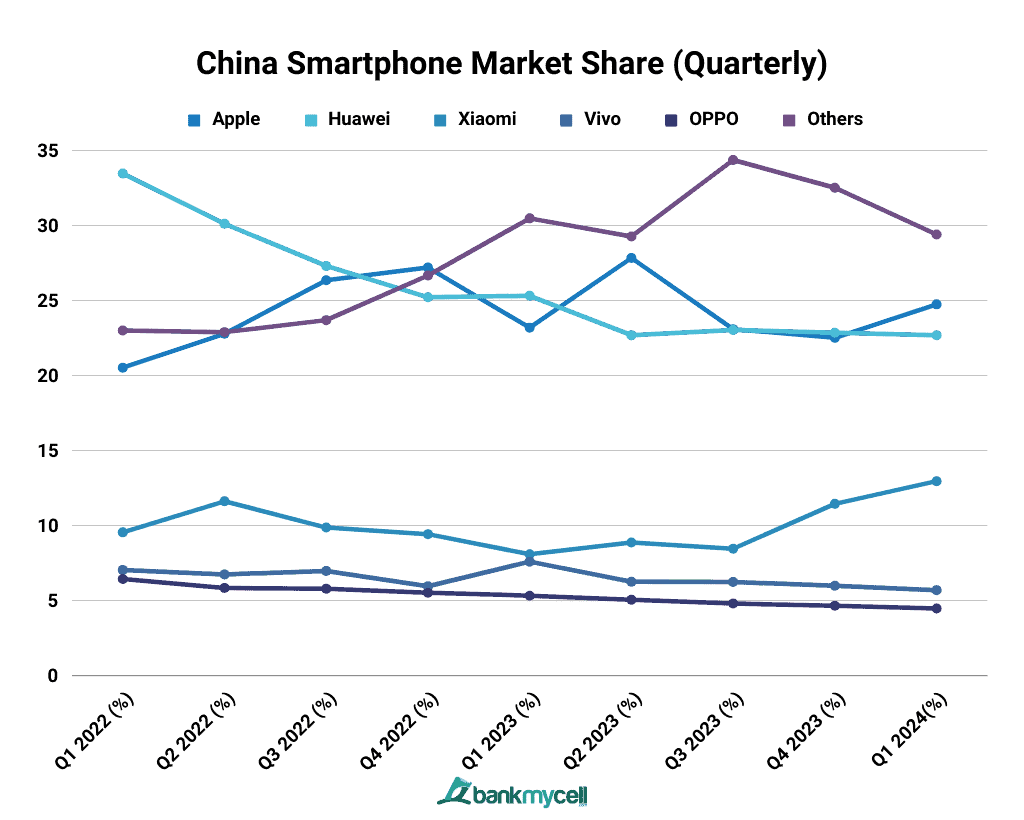
With a 24.74% market share in 2024, Apple has overtaken Huawei as the most dominant player in China’s smartphone market. Huawei is in the second spot, with 22.68% in the same quarter, a 2.06% difference from the top brand Apple. Other brands, such as Xiaomi, Vivo, and OPPO, also maintained their rankings from the previous quarter, with recent figures at 12.96%, 5.70%, and 4.48% market share, respectively.
In the second quarter of 2022, China’s smartphone shipments showed a 10% year-on-year (YOY) decrease, from around 74 million to 67 million units. Sales of foldable smartphones in the country, however, grew by 132.4% in the same period.
China Smartphone Market Share (2013-2024)
| Brands | 2013 | 2014 | 2015 | 2016 | 2017 | 2018 | 2019 | 2020 | 2021 | 2022 | 2023 | 2024 |
|---|---|---|---|---|---|---|---|---|---|---|---|---|
| Apple | 16.29 | 22.3 | 24.45 | 22.79 | 25.05 | 21.96 | 21.33 | 18.47 | 20.7 | 24.32 | 24.22 | 24.74 |
| Huawei | 6.96 | 8.63 | 10.2 | 13.77 | 17.99 | 21.38 | 20.57 | 30.31 | 37.6 | 28.92 | 23.5 | 22.68 |
| Xiaomi | 3.98 | 10.05 | 14.87 | 11.5 | 10.33 | 9.9 | 8.49 | 9.04 | 7.79 | 10.03 | 9.11 | 12.96 |
| Vivo | - | - | 0.01 | 0.06 | 0.03 | 0.01 | 1.07 | 3.22 | 6.02 | 6.68 | 6.54 | 5.7 |
| Oppo | 0.21 | 1.2 | 4.33 | 4.57 | 10.61 | 12.77 | 8.69 | 7.71 | 6.25 | 5.9 | 4.98 | 4.48 |
| 0.55 | 0.58 | 0.31 | 0.34 | 0.11 | 0.22 | 5.76 | 0.28 | 0.65 | 0.83 | 1.72 | 2.09 | |
| Honor | - | - | - | - | - | 0.07 | 0.07 | 0.21 | 0.17 | 0.48 | 0.81 | 1.55 |
| Others | 72.01 | 57.23 | 45.82 | 46.99 | 35.88 | 33.68 | 33.99 | 30.78 | 20.77 | 22.83 | 29.12 | 25.76 |
- Data Table
-
Brands 2013 2014 2015 2016 2017 2018 2019 2020 2021 2022 2023 2024 Apple 16.29 22.3 24.45 22.79 25.05 21.96 21.33 18.47 20.7 24.32 24.22 24.74 Huawei 6.96 8.63 10.2 13.77 17.99 21.38 20.57 30.31 37.6 28.92 23.5 22.68 Xiaomi 3.98 10.05 14.87 11.5 10.33 9.9 8.49 9.04 7.79 10.03 9.11 12.96 Vivo - - 0.01 0.06 0.03 0.01 1.07 3.22 6.02 6.68 6.54 5.7 Oppo 0.21 1.2 4.33 4.57 10.61 12.77 8.69 7.71 6.25 5.9 4.98 4.48 Google 0.55 0.58 0.31 0.34 0.11 0.22 5.76 0.28 0.65 0.83 1.72 2.09 Honor - - - - - 0.07 0.07 0.21 0.17 0.48 0.81 1.55 Others 72.01 57.23 45.82 46.99 35.88 33.68 33.99 30.78 20.77 22.83 29.12 25.76 - Data Graph
-

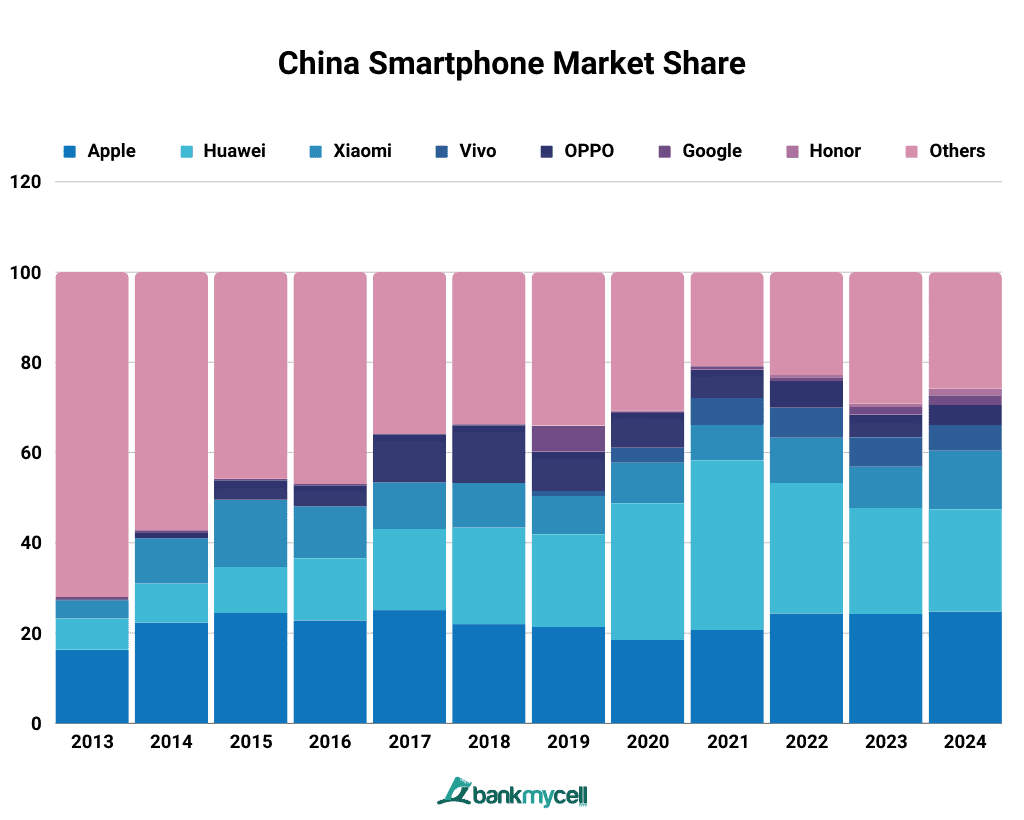
Apple currently has a yearly market share of 24.74% in China. At present, it is the largest smartphone brand share in the country.
In 2020, Huawei managed to become the top smartphone in China by skyrocketing its market share by almost 10% from the previous year. It took 30.31% brand share that year, with Apple coming in second at 18.47%. It maintained its top status from 2020 to 2022. Before this, Apple held the biggest market share in the country from 2012 to 2019.
APPLE
Mobile Phone Market Share of Apple in China
The current monthly market share of Apple is 24.74%. Historically, Apple reached its peak in the Chinese market on April 2017, when it reached a 43.69% brand share.
Apple Market Share in China (By Quarter)
iPhone Market Share by Quarter
| Quarter | Market Share |
|---|---|
| Q1 2024 | 24.74% |
| Q4 2023 | 22.55% |
| Q3 2023 | 23.09% |
| Q2 2023 | 27.83% |
| Q1 2023 | 23.19% |
| Q4 2022 | 27.19% |
| Q3 2022 | 26.35% |
| Q2 2022 | 22.78% |
| Q1 2022 | 20.52% |
| Q4 2021 | 19.73% |
- Data Table
-
iPhone Market Share by Quarter
Quarter Market Share Q1 2024 24.74% Q4 2023 22.55% Q3 2023 23.09% Q2 2023 27.83% Q1 2023 23.19% Q4 2022 27.19% Q3 2022 26.35% Q2 2022 22.78% Q1 2022 20.52% Q4 2021 19.73% - Data Graph
-

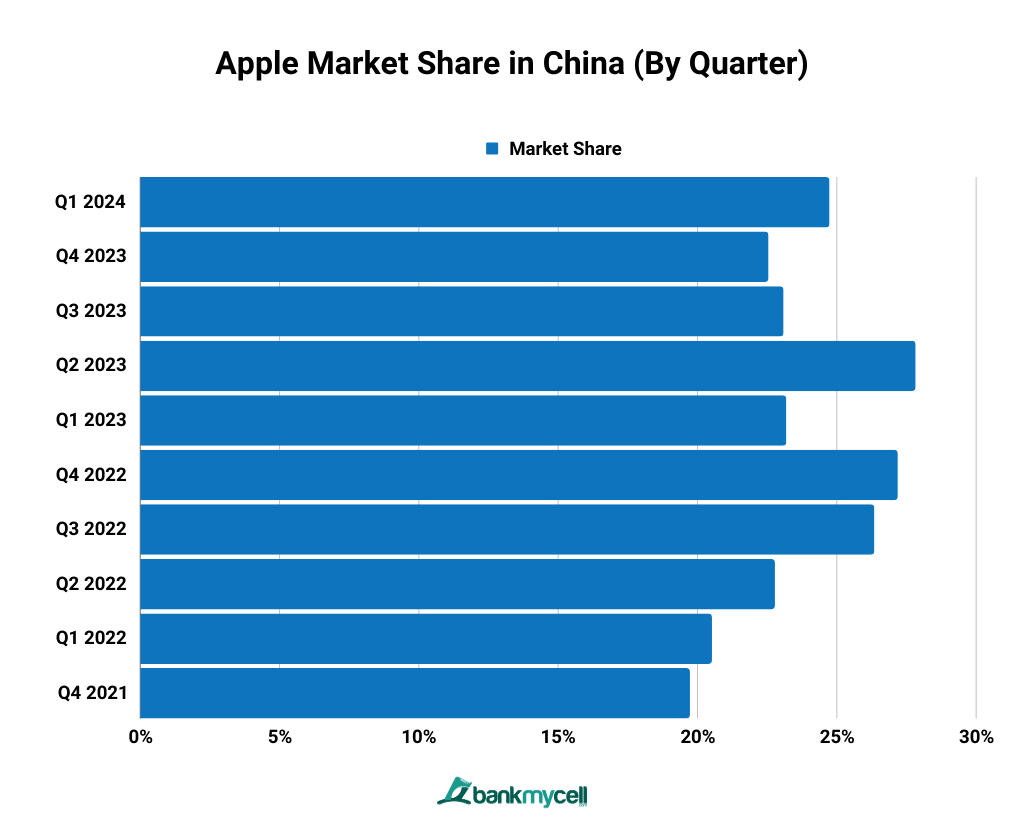
Apple ranked first in China’s smartphone market with a 24.74% market share in the first quarter of 2024. This is a 2.19% increase in brand share compared to the fourth quarter of 2023.
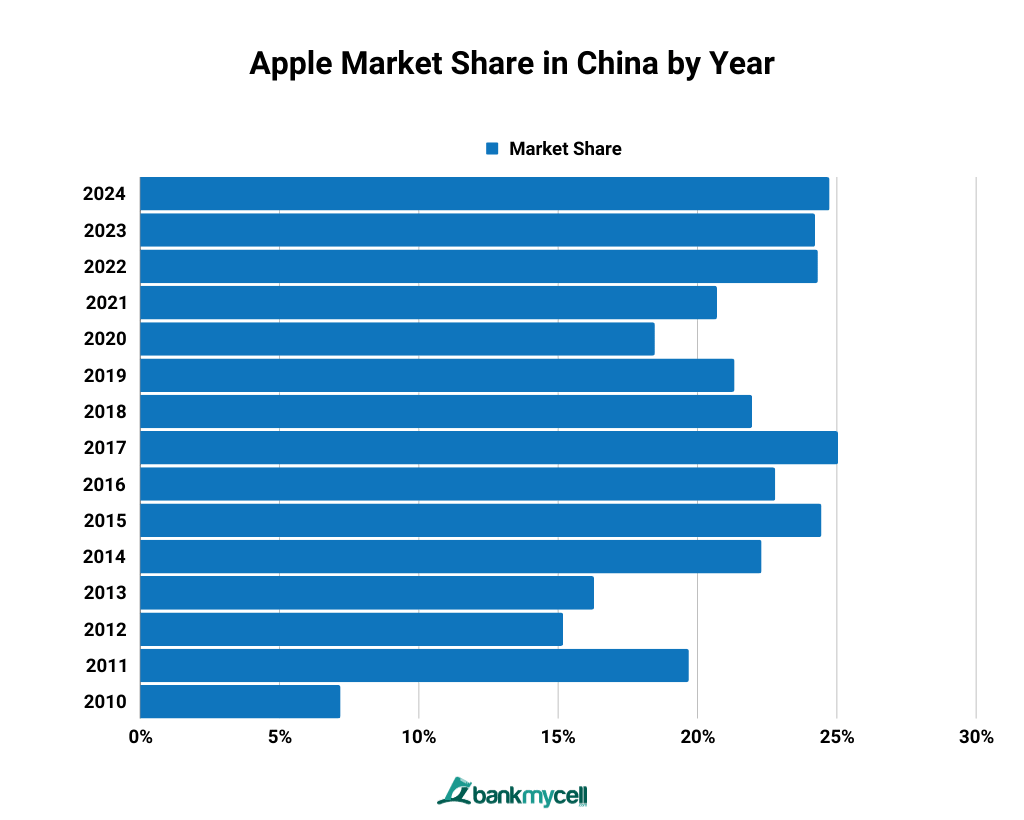
Apple Market Share in China by Year (2010-2024)
iPhone Market Share by Year
| Year | Market Share |
|---|---|
| 2024 | 24.74% |
| 2023 | 24.22% |
| 2022 | 24.32% |
| 2021 | 20.70% |
| 2020 | 18.47% |
| 2019 | 21.33% |
| 2018 | 21.96% |
| 2017 | 25.05% |
| 2016 | 22.79% |
| 2015 | 24.45% |
| 2014 | 22.30% |
| 2013 | 16.29% |
| 2012 | 15.18% |
| 2011 | 19.69% |
| 2010 | 7.19% |
- Data Table
-
iPhone Market Share by Year
Year Market Share 2024 24.74% 2023 24.22% 2022 24.32% 2021 20.70% 2020 18.47% 2019 21.33% 2018 21.96% 2017 25.05% 2016 22.79% 2015 24.45% 2014 22.30% 2013 16.29% 2012 15.18% 2011 19.69% 2010 7.19% - Data Graph
-

Apple currently has a yearly market share of 24.74% in China. From 2012-2019, Apple held the biggest market share in China, peaking at 25.05% in 2017. It was surpassed by Huawei from 2020 to 2022. In 2023, Apple took back its position as the leading smartphone vendor in China by yearly market share.
The iPhone 13 has accounted for over 60% of Apple’s smartphone shipments in 2022, allowing the company to maintain its year-on-year solid growth rate.
Apple’s annual share increase in 2021, particularly on November 11, is remarkable because it occurred at a time when many Chinese consumers were holding back purchases in anticipation of Singles’ Day sales.
HUAWEI
Huawei Market Share in China
The current monthly market share of Huawei is 22.68%, sliding down to the second spot in the smartphone market in China. Its market share is 2.06% lower than its closest competitor, Apple.
Huawei’s P40 and P40 Pro 5G series, the Mate 30 5G series, and the Nova 7 5G series garnered positive feedback in the market, putting them at the top of the best-selling smartphone model list in China. It also expanded its market presence with the 4G-only Mate series, showing high demand from Chinese customers and channel partners.
Huawei Smartphone Market Share in China (By Quarter)
Huawei’s Share in China by Quarter
| Quarter | Market Share |
|---|---|
| Q1 2024 | 22.68% |
| Q4 2023 | 22.85% |
| Q3 2023 | 23.03% |
| Q2 2023 | 22.69% |
| Q1 2023 | 25.31% |
| Q4 2022 | 25.21% |
| Q3 2022 | 27.30% |
| Q2 2022 | 30.11% |
| Q1 2022 | 33.46% |
| Q4 2021 | 36.46% |
- Data Table
-
Huawei’s Share in China by Quarter
Quarter Market Share Q1 2024 22.68% Q4 2023 22.85% Q3 2023 23.03% Q2 2023 22.69% Q1 2023 25.31% Q4 2022 25.21% Q3 2022 27.30% Q2 2022 30.11% Q1 2022 33.46% Q4 2021 36.46% - Data Graph
-

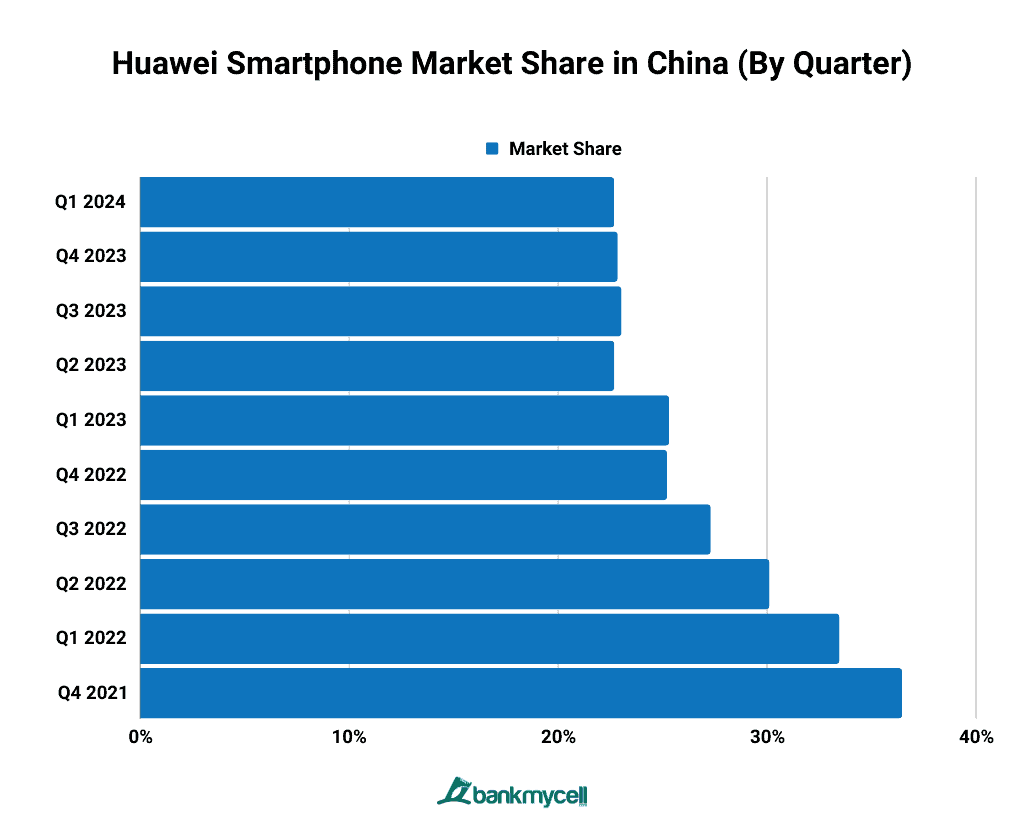
While Huawei has mostly topped the recent quarterly shares of the Chinese smartphone market in the past couple of years, but Apple overtook it again in Q2 2023 with a 5.14% difference. Huawei continues to be in second place in 2024. The vendor, however, shows a decline of 2.63% compared to its brand share in early 2023.
Key Stats:
- According to Huawei, their revenue totaled ¥445.8b or over $61b in the first three quarters of 2022. Huawei’s main business profit margin was 6.1%.
- According to Huawei Technologies, its device business, which includes phones and other consumer devices, is facing its “most difficult” time ever in 2022. It comes as the company grips with a US clampdown and economic uncertainty.
Huawei’s Yearly Share in China Smartphone Market (2012–2024)
Huawei Market Share in China By Year
| Year | Market Share |
|---|---|
| 2024 | 22.68% |
| 2023 | 23.50% |
| 2022 | 28.92% |
| 2021 | 37.60% |
| 2020 | 30.31% |
| 2019 | 20.57% |
| 2018 | 21.38% |
| 2017 | 17.99% |
| 2016 | 13.77% |
| 2015 | 10.20% |
| 2014 | 8.63% |
| 2013 | 6.96% |
| 2012 | 4.51% |
- Data Table
-
Huawei Market Share in China By Year
Year Market Share 2024 22.68% 2023 23.50% 2022 28.92% 2021 37.60% 2020 30.31% 2019 20.57% 2018 21.38% 2017 17.99% 2016 13.77% 2015 10.20% 2014 8.63% 2013 6.96% 2012 4.51% - Data Graph
-

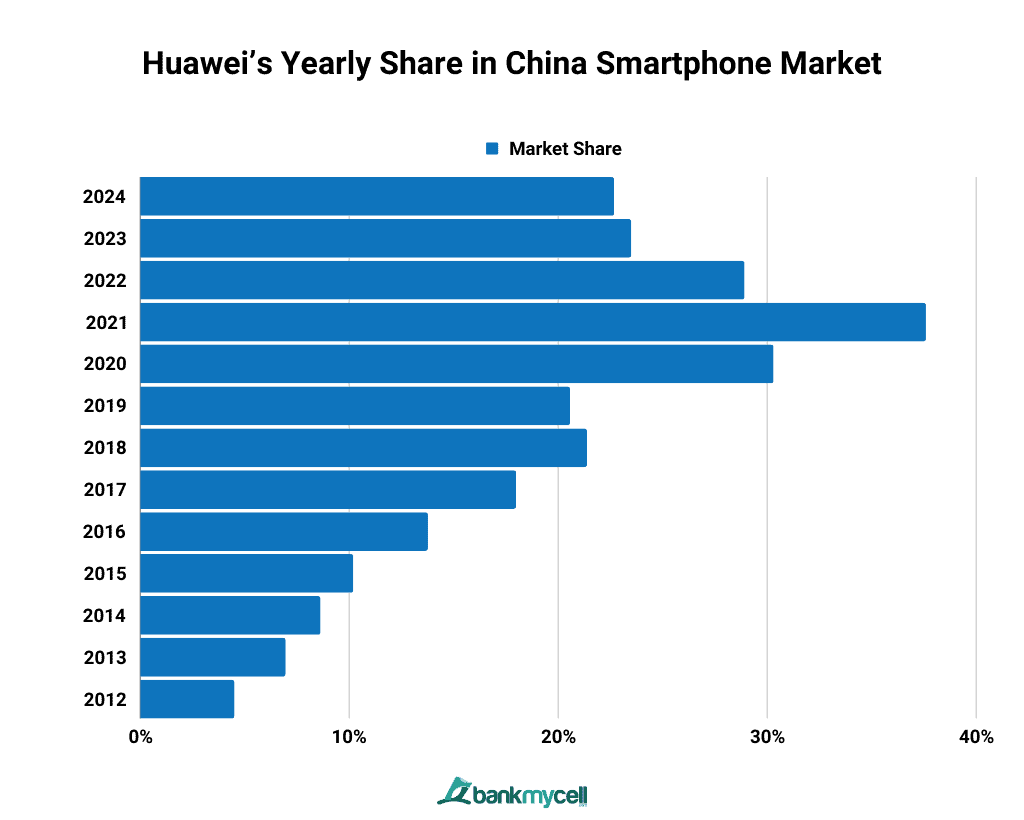
Huawei currently has a 23.68% brand share in 2024, which only comes second to Apple’s 24.74%. It wasn’t until 2020 that Huawei finally took the number one spot on yearly market shares in China. With a share of less than 10% from 2010 to 2014, it consistently rose its market shares until it reached 30.31% in 2020. It held the top spot in yearly market share from 2020 to 2022 until Apple took the position again in 2023.
Key Stats:
- In 2019, Huawei made the most smartphone shipments in the Chinese market, selling more than 140 million devices
VIVO
Mobile Phone Market Share of Vivo in China
The current market share of Vivo is 5.70%. For the year 2023, Vivo peaked in February with 8.15% market share.
Despite smartphone shipments in China falling around 11% year on year in the fourth quarter of 2021, Vivo used its X70 Pro unit to expand its premium product portfolio.
Vivo’s Shares in the Chinese Smartphone Market (By Quarter)
Vivo Market Share in China by Quarter
| Quarter | Market Share |
|---|---|
| Q1 2024 | 5.70% |
| Q4 2023 | 5.99% |
| Q3 2023 | 6.24% |
| Q2 2023 | 6.26% |
| Q1 2023 | 7.60% |
| Q4 2022 | 5.96% |
| Q3 2022 | 6.98% |
| Q2 2022 | 6.75% |
| Q1 2022 | 7.05% |
| Q4 2021 | 6.54% |
- Data Table
-
Vivo Market Share in China by Quarter
Quarter Market Share Q1 2024 5.70% Q4 2023 5.99% Q3 2023 6.24% Q2 2023 6.26% Q1 2023 7.60% Q4 2022 5.96% Q3 2022 6.98% Q2 2022 6.75% Q1 2022 7.05% Q4 2021 6.54% - Data Graph
-

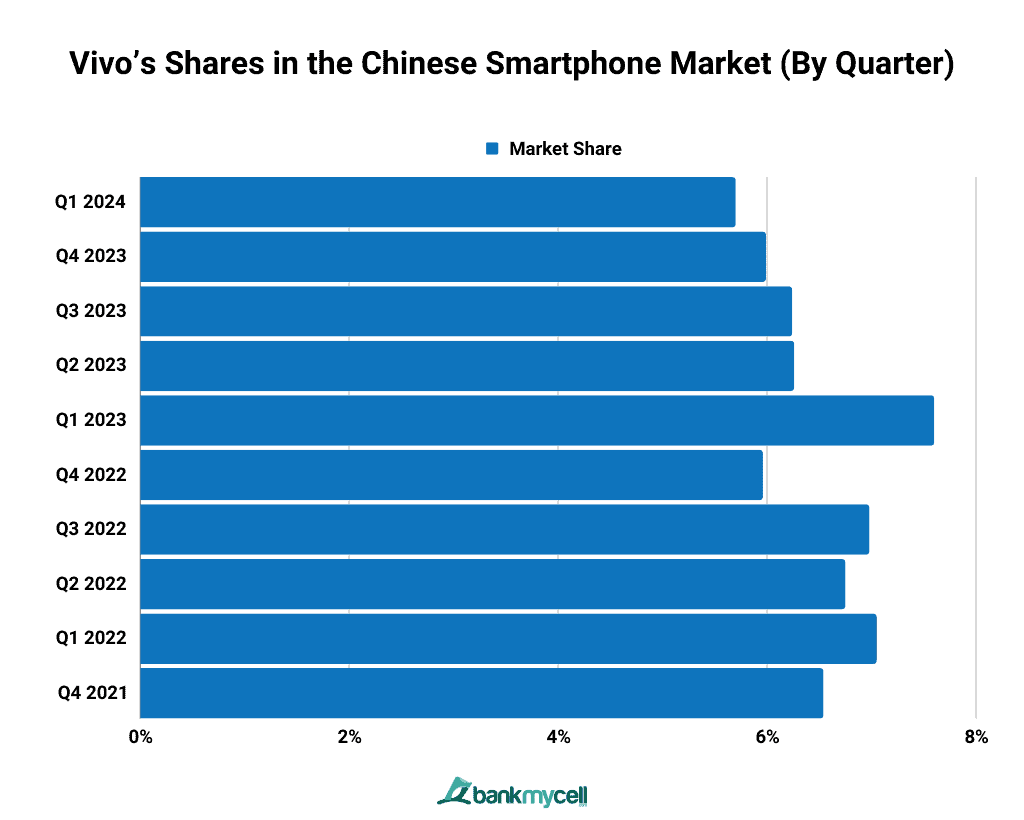
Vivo claimed a 5.70% market share in this quarter. This is a slight decline of 0.29% this quarter compared to the fourth quarter of 2023.
Vivo updated its product portfolio in the third quarter of 2022, and the X Series has seen consistent progress in the premium segment and online channel. Vivo’s bestselling units include their flagship models like the X21 and R15.
Vivo’s Yearly Share in China Smartphone Market (2015–2024)
Vivo Market Share in China By Year
| Year | Market Share |
|---|---|
| 2024 | 5.70% |
| 2023 | 6.54% |
| 2022 | 6.68% |
| 2021 | 6.02% |
| 2020 | 3.22% |
| 2019 | 1.07% |
| 2018 | 0.01% |
| 2017 | 0.03% |
| 2016 | 0.06% |
| 2015 | 0.01% |
- Data Table
-
Vivo Market Share in China By Year
Year Market Share 2024 5.70% 2023 6.54% 2022 6.68% 2021 6.02% 2020 3.22% 2019 1.07% 2018 0.01% 2017 0.03% 2016 0.06% 2015 0.01% - Data Graph
-

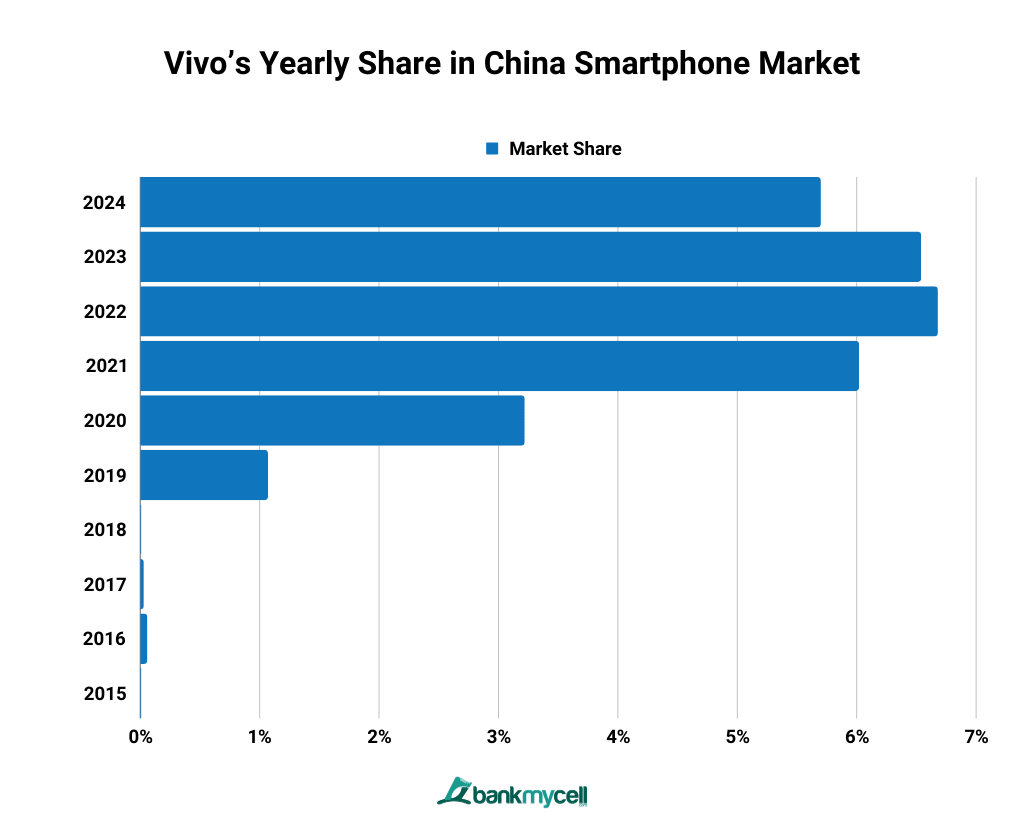
Vivo ranked high on the China market in 2023, claiming the fourth spot with a 5.70% brand share. The company had the highest market penetration rate in 2022 at 6.68%. Vivo saw its highest YOY growth in 2021, with a 3.2% rise in market share.
Key Stats:
- Vivo has grown significantly since 2019, with a 5.47% increase from 2019 to 2023.
- Vivo had its lowest market share in 2015 and 2018, recording 0.01% in both years.
OPPO
OPPO Market Share in China
OPPO’s current monthly market share is at 4.48%. In the year 2023, OPPO’s monthly brand share peaked at 6.32% in May, which means there has been a 1.84% decline for the brand compared to its peak last year.
OPPO’s Shares in the Chinese Smartphone Market (By Quarter)
OPPO Market Share in China by Quarter
| Quarter | Market Share |
|---|---|
| Q1 2024 | 4.48% |
| Q4 2023 | 4.66% |
| Q3 2023 | 4.81% |
| Q2 2023 | 5.06% |
| Q1 2023 | 5.33% |
| Q4 2022 | 5.53% |
| Q3 2022 | 5.80% |
| Q2 2022 | 5.84% |
| Q1 2022 | 6.44% |
| Q4 2021 | 5.83% |
- Data Table
-
OPPO Market Share in China by Quarter
Quarter Market Share Q1 2024 4.48% Q4 2023 4.66% Q3 2023 4.81% Q2 2023 5.06% Q1 2023 5.33% Q4 2022 5.53% Q3 2022 5.80% Q2 2022 5.84% Q1 2022 6.44% Q4 2021 5.83% - Data Graph
-

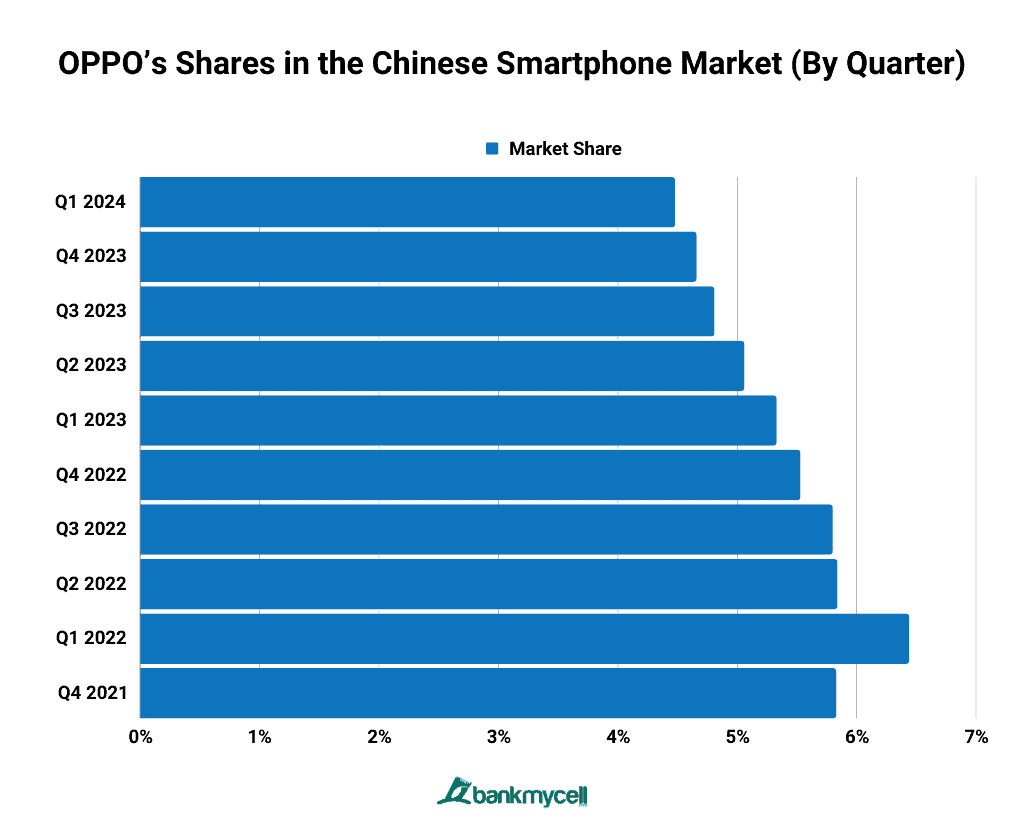
OPPO currently has a quarterly market share of 4.48% in 2024. This is a 0.18% decline compared to the brand’s market share in Q4 2023. OPPO currently has the fifth-highest quarterly brand share in China.
OPPO’s volume drivers for the second quarter of 2022 were the Reno and A series. This is in addition to the Reno 8 series and the A57 models, both of which have sold over two million units.
Due to economic uncertainties, OPPO was less aggressive in launching new products in the home market around the third quarter of 2022.
OPPO’s Yearly Share in China Smartphone Market (2013-2024)
OPPO Market Share in China By Year
| Year | Market Share |
|---|---|
| 2024 | 4.48% |
| 2023 | 4.98% |
| 2022 | 5.90% |
| 2021 | 6.25% |
| 2020 | 7.71% |
| 2019 | 8.69% |
| 2018 | 12.77% |
| 2017 | 10.61% |
| 2016 | 4.57% |
| 2015 | 4.33% |
| 2014 | 1.20% |
| 2013 | 0.21% |
- Data Table
-
OPPO Market Share in China By Year
Year Market Share 2024 4.48% 2023 4.98% 2022 5.90% 2021 6.25% 2020 7.71% 2019 8.69% 2018 12.77% 2017 10.61% 2016 4.57% 2015 4.33% 2014 1.20% 2013 0.21% - Data Graph
-

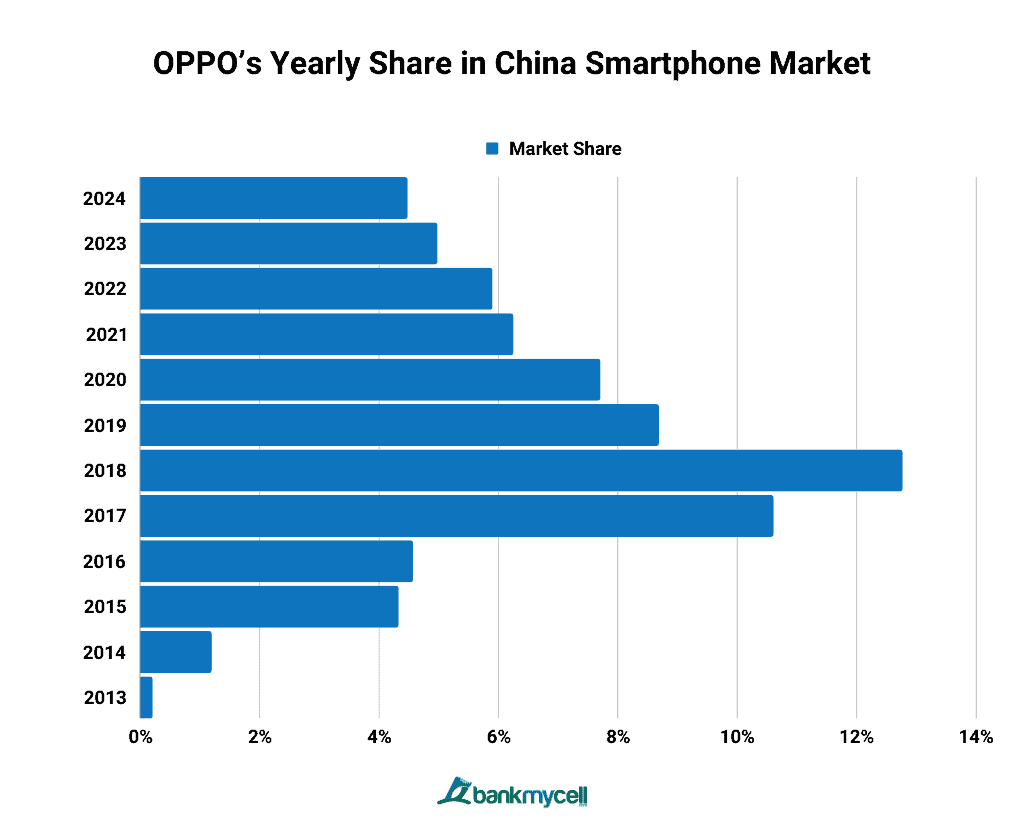
OPPO’s current yearly brand share for 2024 is 4.48%. OPPO saw its highest yearly share in 2018 at 12.77%. This means that there has been a significant decline of 8.29% between OPPO’s highest yearly market penetration rate to its current one.
HONOR
Honor Market Share in China
Based on StatCounter, Honor continues to be a minor player among the smartphone brands in China at 1.55% monthly market share. It now places 7th in the country’s top smartphone brands.
However, Counterpoint Research data shows that Honor took 15-20% brand share in 2022-2023, placing it among Chinese smartphone brands with the highest market penetration rates.
HONOR separated from Huawei in the fourth quarter of 2020, and its market share does not include Huawei brand family volumes beginning in the first quarter of 2021.
Honor Smartphone Market Share in China (By Quarter)
Honor Market Share in China by Quarter
| Quarter | Market Share |
|---|---|
| Q1 2024 | 1.55% |
| Q4 2023 | 1.41% |
| Q3 2023 | 0.77% |
| Q2 2023 | 0.61% |
| Q1 2023 | 0.54% |
| Q4 2022 | 0.59% |
| Q3 2022 | 0.46% |
| Q2 2022 | 0.44% |
| Q1 2022 | 0.42% |
| Q4 2021 | 0.15% |
- Data Table
-
Honor Market Share in China by Quarter
Quarter Market Share Q1 2024 1.55% Q4 2023 1.41% Q3 2023 0.77% Q2 2023 0.61% Q1 2023 0.54% Q4 2022 0.59% Q3 2022 0.46% Q2 2022 0.44% Q1 2022 0.42% Q4 2021 0.15% - Data Graph
-

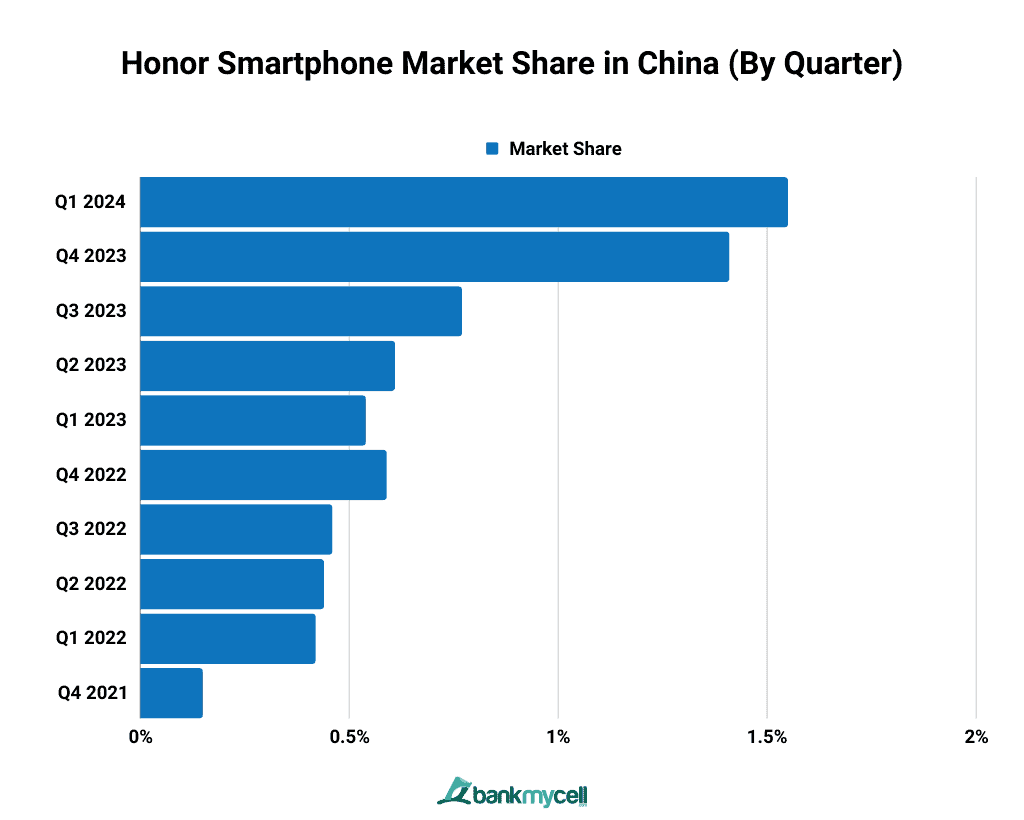
According to Statcounter, Honor reached 1.55% brand share in the most recent quarter of 2024. This places the brand in the 7th spot in terms of market share in China.
Honor’s market share increased by 0.02% by the second quarter of 2022, thanks to the company’s coverage in lower-tier cities, where there were fewer lockdowns.
Key Stats:
- Due to US sanctions, Huawei was forced to sell Honor in November 2020, transforming it into an independent brand.
- According to Counterpoint analyst Archie Zhang, the company expected to keep its growth momentum going with new products like the Honor 60 and its foldable smartphone, the Magic V.
- Experts predict that Honor will attempt to expand in the premium segment to reclaim some of Apple’s market share in 2021.
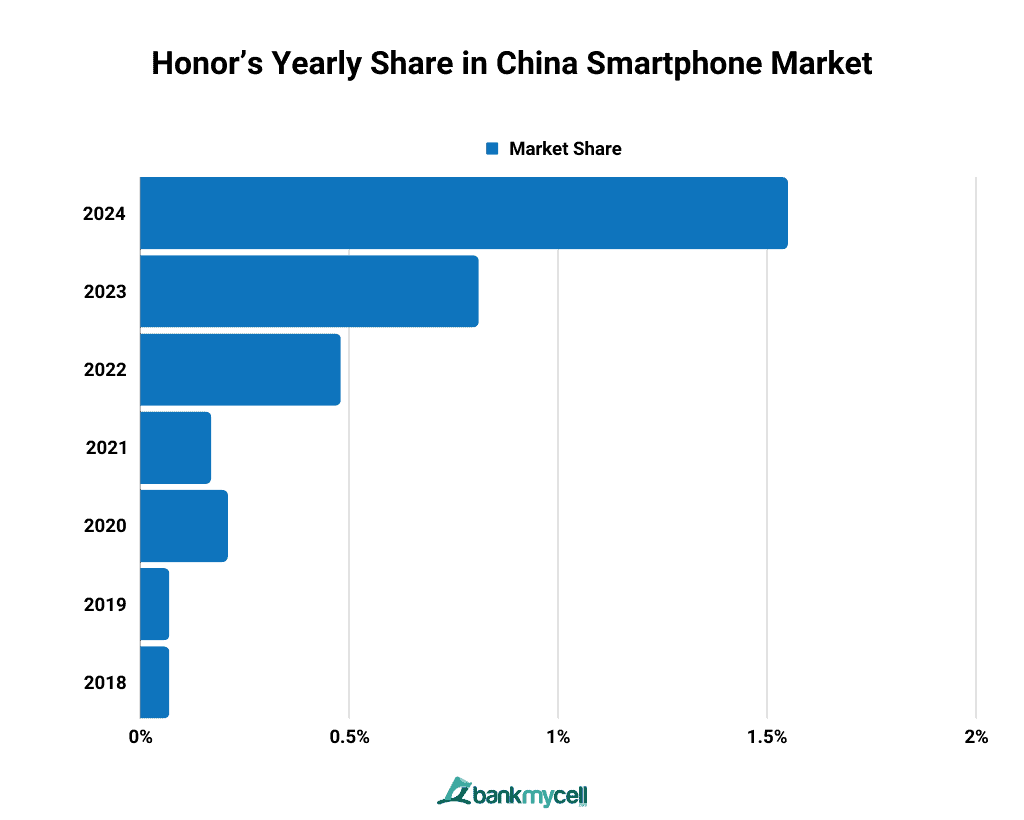
Honor’s Yearly Share in China Smartphone Market (2018–2024)
Honor Market Share By Year
| Year | Market Share |
|---|---|
| 2024 | 1.55% |
| 2023 | 0.81% |
| 2022 | 0.48% |
| 2021 | 0.17% |
| 2020 | 0.21% |
| 2019 | 0.07% |
| 2018 | 0.07% |
- Data Table
-
Honor Market Share By Year
Year Market Share 2024 1.55% 2023 0.81% 2022 0.48% 2021 0.17% 2020 0.21% 2019 0.07% 2018 0.07% - Data Graph
-

According to StatCounter, Honor currently holds 1.55% of the yearly market share in 2024. It represents a 0.74% increase from the previous year.
Honor’s year-on-year smartphone sales doubled from Q1 2021 to Q2 2022, making it the only major brand to do so during that time period. Smartphone shipments for the vendor increased by a year-on-year growth of 190% by the first quarter of 2022.
Honor became China’s fastest-growing original equipment manufacturer in the third quarter of 2021, with 96% quarter-on-quarter (QoQ) sales growth.
According to Archie Zhang, a Counterpoint analyst, Honor’s mid-range to high-end phones helped drive the brand’s sales, with its Honor 50 model holding the top spot in the $200-$599 price range for five months after its June launch.
XIAOMI
Xiaomi Market Share in China
Xiaomi’s current monthly market share is 12.96%. This is a 0.05% increase from the vendor’s highest monthly market penetration rate in 2023, which peaked at 12.91%.
Xiaomi is heavily investing in R&D, with CNY 100 billion set aside for innovation investments over the next five years to support its premiumization strategy.
Xiaomi Smartphone Market Share in China (By Quarter)
Xiaomi Market Share by Quarter
| Quarter | Market Share |
|---|---|
| Q1 2024 | 12.96% |
| Q4 2023 | 11.45% |
| Q3 2023 | 8.46% |
| Q2 2023 | 8.88% |
| Q1 2023 | 8.09% |
| Q4 2022 | 9.43% |
| Q3 2022 | 9.87% |
| Q2 2022 | 11.62% |
| Q1 2022 | 9.55% |
| Q4 2021 | 7.44% |
- Data Table
-
Xiaomi Market Share by Quarter
Quarter Market Share Q1 2024 12.96% Q4 2023 11.45% Q3 2023 8.46% Q2 2023 8.88% Q1 2023 8.09% Q4 2022 9.43% Q3 2022 9.87% Q2 2022 11.62% Q1 2022 9.55% Q4 2021 7.44% - Data Graph
-

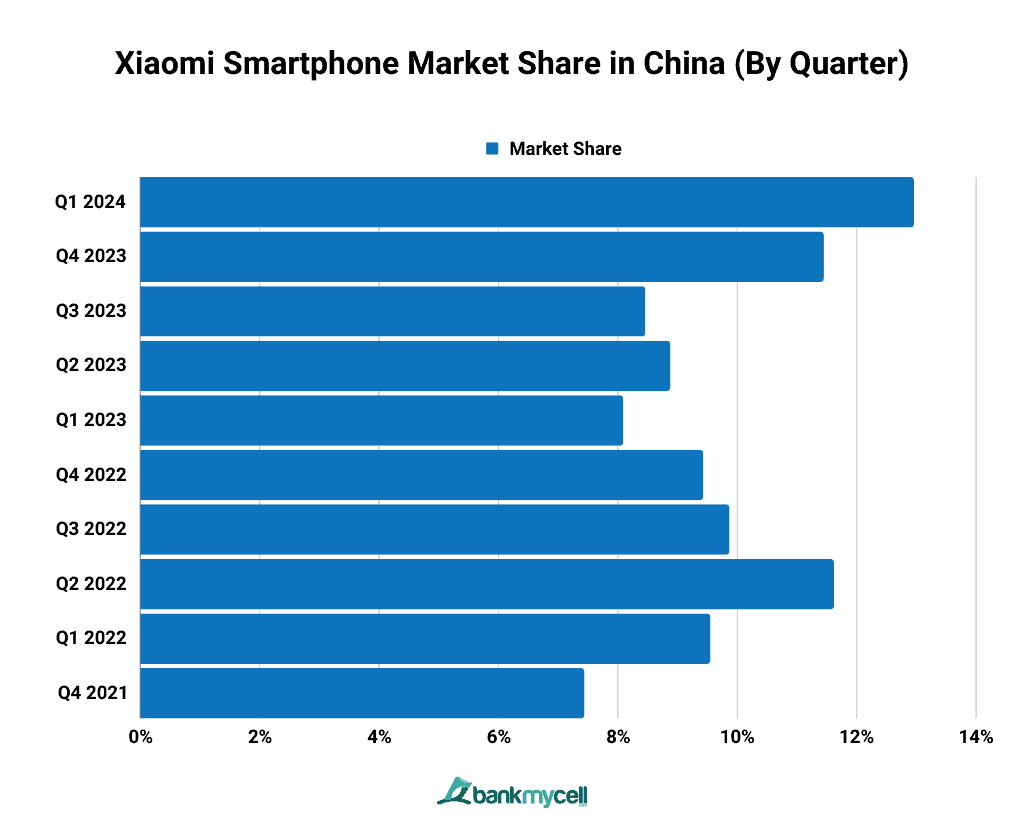
Xiaomi’s quarterly brand share in 2024 is at 12.96%. Compared to the vendor’s market penetration rate in Q4 2023, this is a 1.15% increase. For the year 2022, Xiaomi had its highest share in the second quarter at 11.62%. Xiaomi also ranked third in China’s top brands with the highest market share over the last four quarters.
Key Stats:
- Xiaomi shipped 11 million smartphones in the first quarter of 2022.
- Xiaomi’s market share increased in the second quarter of 2022 as a result of its Redmi K and Redmi Note series. This is where its market started to recover, and sales promotions began in May. Lower pricing helped sales of the high-end Mi 12 series during the “6.18” shopping campaign.
- Xiaomi had a 9% market share in Q3 2022, but it lost 17.9% from its year-on-year sales.
Xiaomi’s Yearly Share in China Smartphone Market (2012–2024)
Xiaomi’s Annual Market Share in the Chinese Market
| Year | Market Share |
|---|---|
| 2024 | 12.96% |
| 2023 | 9.11% |
| 2022 | 10.03% |
| 2021 | 7.79% |
| 2020 | 9.04% |
| 2019 | 8.49% |
| 2018 | 9.90% |
| 2017 | 10.33% |
| 2016 | 11.50% |
| 2015 | 14.87% |
| 2014 | 10.05% |
| 2013 | 3.98% |
| 2012 | 2.13% |
- Data Table
-
Xiaomi’s Annual Market Share in the Chinese Market
Year Market Share 2024 12.96% 2023 9.11% 2022 10.03% 2021 7.79% 2020 9.04% 2019 8.49% 2018 9.90% 2017 10.33% 2016 11.50% 2015 14.87% 2014 10.05% 2013 3.98% 2012 2.13% - Data Graph
-

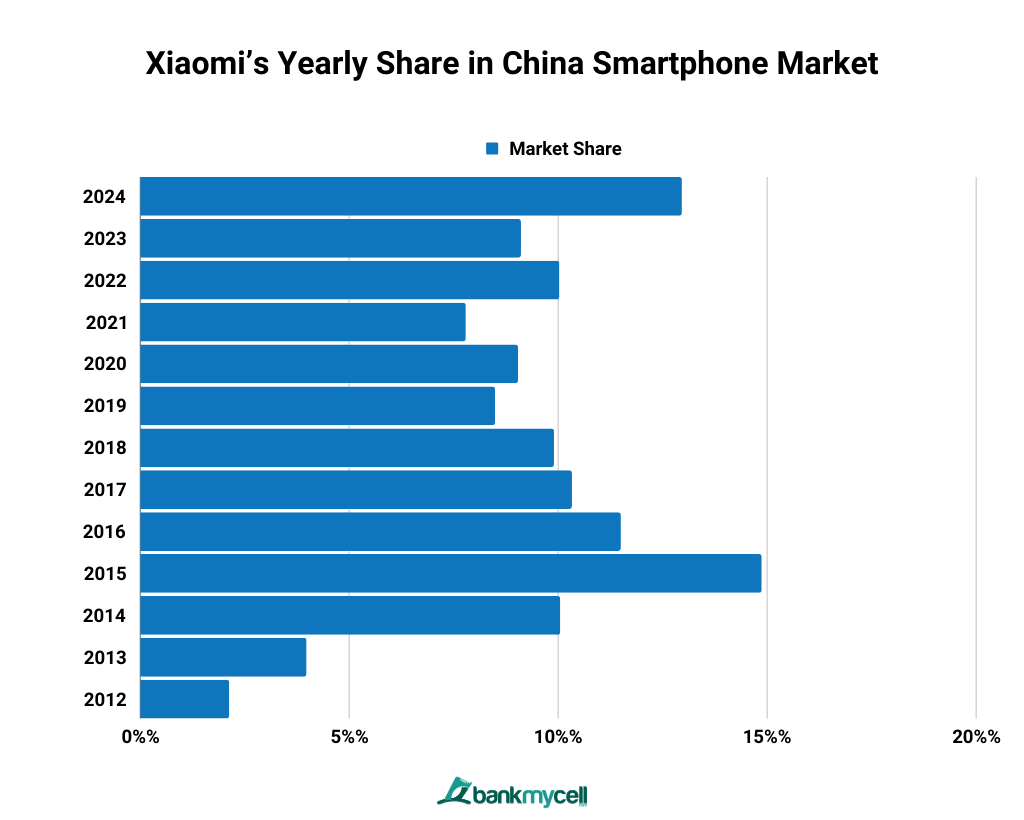
In 2024, Xioami had a 12.96% yearly market share, placing it third among China’s top smartphone brands. It is worth noting that its highest market share was in 2015, when it held 14.87%.
Xiaomi’s premium smartphone shipments in China, priced at CNY 3,000 and above, more than doubled in 2021 to 24 million units from the previous year.