Samsung Market Share, Users & Revenue Statistics (2024)


How Many People Have Samsung Smartphones?
Did you know that around 1.033 billion people worldwide use Samsung smartphones in 2024? At around 7.41 billion smartphone users globally in 2024, it shows that Samsung’s smartphone penetration rate is relatively high, making it one of the leading Android manufacturers in the world.
Approximately 259 million Samsung units were shipped worldwide in 2022, with Samsung aiming to surpass that figure and sell around 270 million units in 2023.
In this article, you will learn about the growth of Samsung’s Android phone users globally, their latest global market share, and market trends affecting the company’s position in the market
Editors Picks:
- Samsung smartphone market share: Samsung has a market share of 24% in 2024.
- Samsung sales/shipments globally: Taking a 21% share of global shipments, 2 out of 10 phones shipped worldwide are Samsung phones. Approximately 258.20 million Samsung smartphone units were sold in 2022. Reports show that Samsung’s target for 2023 is to ship 270 million units.
- How many people use Samsung Galaxy: There are approximately 1.033 billion Samsung users in the global smartphone market. This is approximately 14% of the total smartphone end users worldwide in 2024.
In this Article:
- Samsung Market Share for Smartphones
- Samsung Market Share vs. Apple
- Samsung Phone Sales / Unit Shipments Worldwide
- Samsung Share of Global Shipments Worldwide
- Samsung Electronics Revenue
- Revenue of Samsung’s Mobile Communications Segment
- Mobile Device Revenue Market Share: Samsung vs. Apple
- How Many Samsung Phone Users Are There?
Samsung Market Share for Smartphones
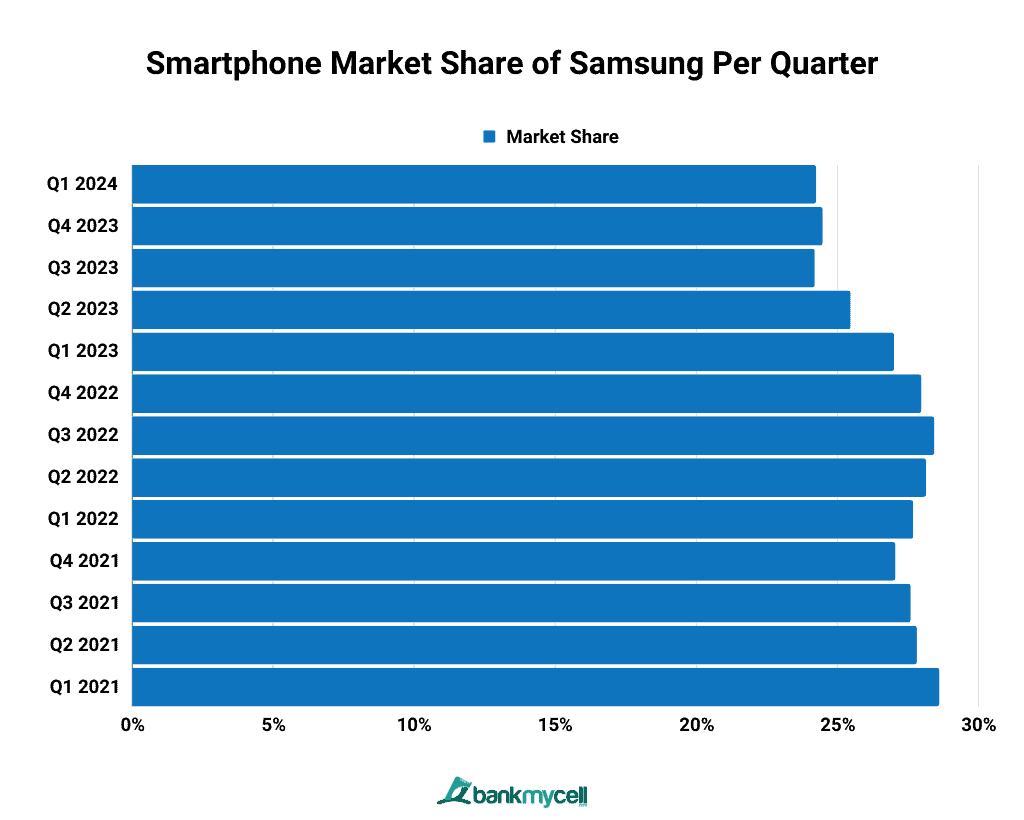
Samsung currently has a market share of 24% in 2024. The brand came in second to Apple with a difference of 5% in market share. The two smartphone manufacturers have been closely competing for the first rank since the third quarter of 2021.
Smartphone Market Share of Samsung Per Quarter
Samsung’s global smartphone market share is 24.25% in the first quarter of 2024, a 0.23% decrease from the previous quarter.
Samsung’s Global Smartphone Market Share by Quarter
| Quarter | Market Share (%) |
|---|---|
| Q1 2024 | 24.25% |
| Q4 2023 | 24.48% |
| Q3 2023 | 24.20% |
| Q2 2023 | 25.47% |
| Q1 2023 | 27.01% |
| Q4 2022 | 27.98% |
| Q3 2022 | 28.44% |
| Q2 2022 | 28.15% |
| Q1 2022 | 27.69% |
| Q4 2021 | 27.06% |
| Q3 2021 | 27.60% |
| Q2 2021 | 27.82% |
| Q1 2021 | 28.62% |
- Data Table
-
Samsung’s Global Smartphone Market Share by Quarter
Quarter Market Share (%) Q1 2024 24.25% Q4 2023 24.48% Q3 2023 24.20% Q2 2023 25.47% Q1 2023 27.01% Q4 2022 27.98% Q3 2022 28.44% Q2 2022 28.15% Q1 2022 27.69% Q4 2021 27.06% Q3 2021 27.60% Q2 2021 27.82% Q1 2021 28.62% - Data Graphic
-

Key Stats:
- Data shows that in the past recent quarters, Samsung’s market share peaked in the first quarter of 2021 at 28.62%.
- Samsung’s lowest market share in the previous recent quarters was in the third quarter of 2023 when it had a share of 24.22%.
Samsung Market Share vs. Apple
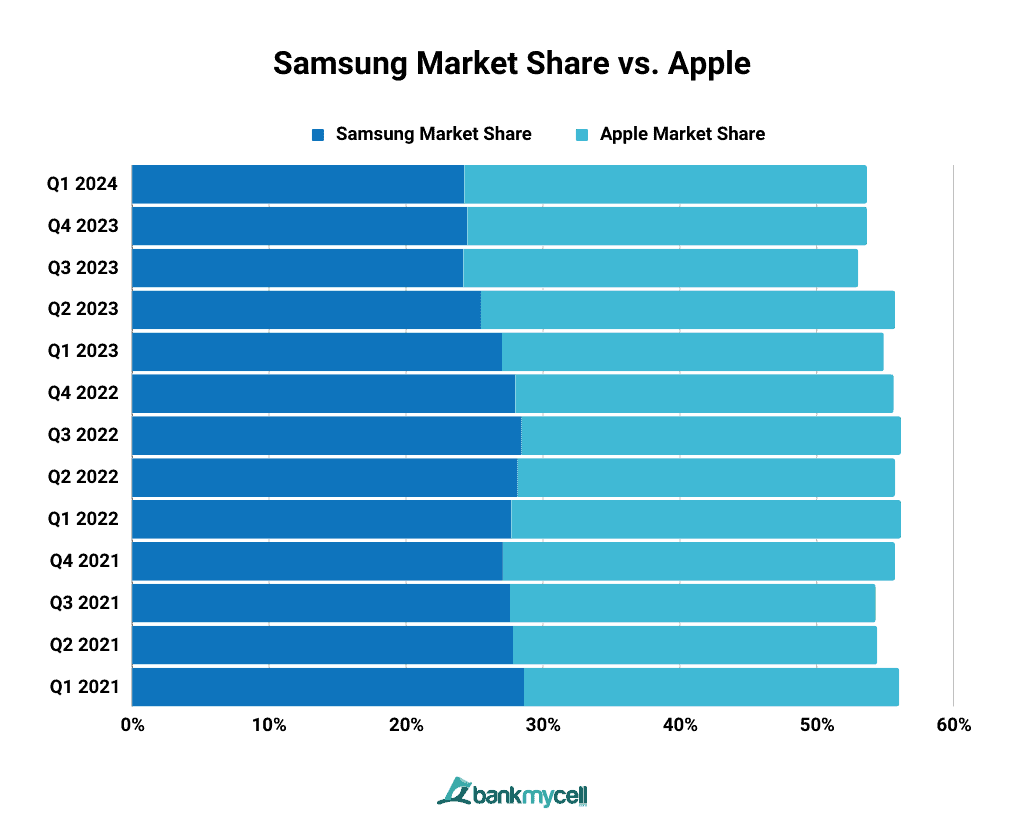
Samsung smartphones’ market share came only second to Apple’s iPhones at 24.25% in the first quarter of 2024. Apple took the first spot at 29.43% market share. This was not always the case, as the Samsung Galaxy market share has mostly taken the largest share for several years. Apple, however, managed its first lead in Q4 2021 and Q1 2022 and has closely competed with Samsung for the top spot after that.
Samsung vs. Apple Market Share by Quarter
| Quarter | Samsung Market Share | Apple Market Share |
|---|---|---|
| Q1 2024 | 24.25% | 29.41% |
| Q2 2023 | 24.48% | 29.19% |
| Q3 2023 | 24.20% | 28.83% |
| Q2 2023 | 25.47% | 30.25% |
| Q1 2023 | 27.01% | 27.89% |
| Q4 2022 | 27.98% | 27.64% |
| Q3 2022 | 28.44% | 27.71% |
| Q2 2022 | 28.15% | 27.58% |
| Q1 2022 | 27.69% | 28.46% |
| Q4 2021 | 27.06% | 28.66% |
| Q3 2021 | 27.60% | 26.70% |
| Q2 2021 | 27.82% | 26.60% |
| Q1 2021 | 28.62% | 27.41% |
- Data Table
-
Samsung vs. Apple Market Share by Quarter
Quarter Samsung Market Share Apple Market Share Q1 2024 24.25% 29.41% Q2 2023 24.48% 29.19% Q3 2023 24.20% 28.83% Q2 2023 25.47% 30.25% Q1 2023 27.01% 27.89% Q4 2022 27.98% 27.64% Q3 2022 28.44% 27.71% Q2 2022 28.15% 27.58% Q1 2022 27.69% 28.46% Q4 2021 27.06% 28.66% Q3 2021 27.60% 26.70% Q2 2021 27.82% 26.60% Q1 2021 28.62% 27.41% - Data Graphic
-

Section
Samsung Phone Sales and Unit Shipments Worldwide (2022/2023)
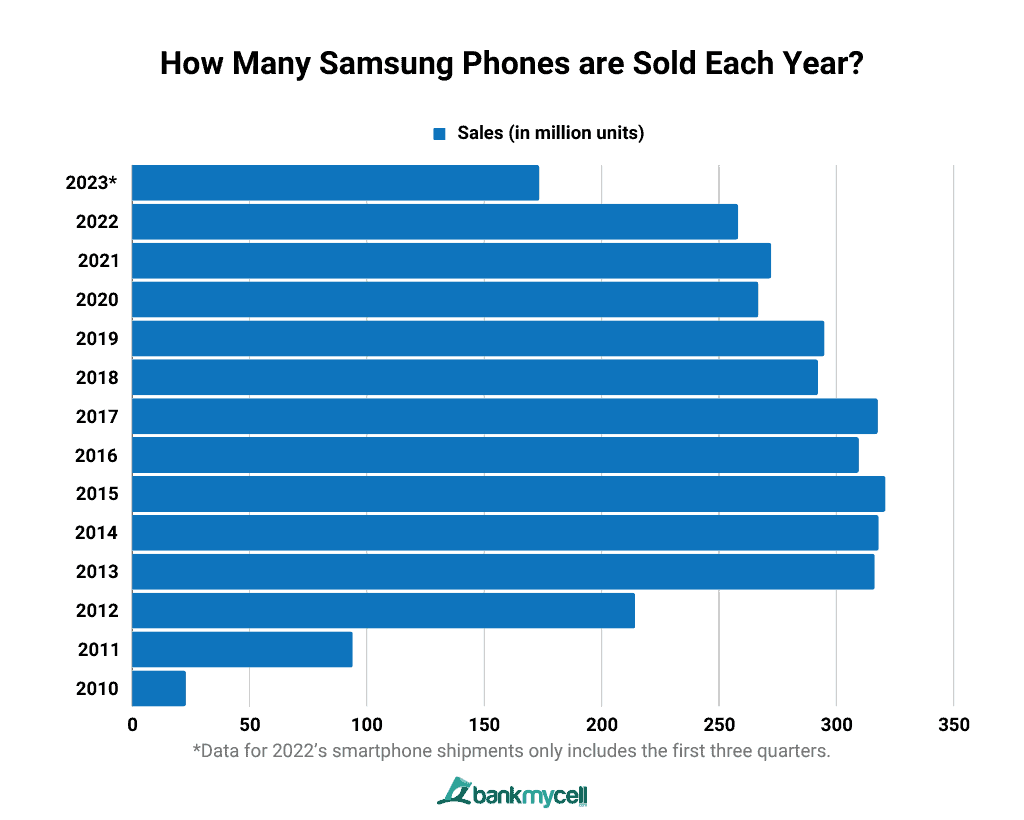
Samsung sold around 173.5 million smartphone units in the first three quarters of 2023. According to reports, the smartphone manufacturer’s target for 2023 is to ship 270 million units.
How Many Samsung Phones are Sold Each Year? (2010-2023)
Samsung sold approximately 258.2 million phones as of 2022. It’s a decline of around 14.1 million from the overall sales of 2021. In the past five years, Samsung’s yearly sales peaked in 2019, when it sold 295 million phone units.
Samsung’s Yearly Sales
| Year | Sales (Million USD) |
|---|---|
| 2023 | 173.5 million |
| 2022 | 258.2 million |
| 2021 | 272.3 million |
| 2020 | 266.8 million |
| 2019 | 295 million |
| 2018 | 292.2 million |
| 2017 | 317.7 million |
| 2016 | 309.6 million |
| 2015 | 321 million |
| 2014 | 318.1 million |
| 2013 | 316.4 million |
| 2012 | 214.3 million |
| 2011 | 94 million |
| 2010 | 22.9 million |
*Data for 2023’s smartphone shipments only includes the first quarter.
- Data Table
-
Samsung’s Yearly Sales
Year Sales (Million USD) 2023 173.5 million 2022 258.2 million 2021 272.3 million 2020 266.8 million 2019 295 million 2018 292.2 million 2017 317.7 million 2016 309.6 million 2015 321 million 2014 318.1 million 2013 316.4 million 2012 214.3 million 2011 94 million 2010 22.9 million *Data for 2023’s smartphone shipments only includes the first quarter.
- Data Graphic
-

Samsung Share of Global Shipments Worldwide
In the second quarter of 2023, Samsung’s share in global smartphone shipments reached 21.0%, implying that 2 out of every 10 phones shipped globally are Samsung Galaxy phones. This is a 1.0% decline from the previous quarter.
Share of Smartphone Shipments Worldwide: Samsung vs. Apple
| Quarter | Samsung’s Share of Smartphone Shipments | Apple’s Share of Smartphone Shipments |
|---|---|---|
| Q2 2023 | 21% | 17% |
| Q1 2023 | 22% | 21% |
| Q4 2022 | 20% | 25% |
| Q3 2022 | 22% | 18% |
| Q2 2022 | 21% | 17% |
| Q1 2022 | 24% | 18% |
| Q4 2021 | 19% | 23% |
| Q3 2021 | 23% | 15% |
| Q2 2021 | 19% | 14% |
| Q1 2021 | 22% | 15% |
| Q4 2020 | 17% | 23% |
| Q3 2020 | 23% | 14.40% |
| Q2 2020 | 18.90% | 15.80% |
| Q1 2020 | 21.90% | 13.60% |
| Q4 2019 | 19.20% | 21.30% |
| Q2 2019 | 22.40% | 12.30% |
| Q1 2019 | 23.20% | 10.90% |
| Q4 2018 | 22.80% | 12.80% |
| Q3 2018 | 20.40% | 13.40% |
| Q2 2018 | 21.40% | 12.20% |
| Q1 2018 | 23.60% | 15.50% |
- Data Table
-
Share of Smartphone Shipments Worldwide: Samsung vs. Apple
Quarter Samsung’s Share of Smartphone Shipments Apple’s Share of Smartphone Shipments Q2 2023 21% 17% Q1 2023 22% 21% Q4 2022 20% 25% Q3 2022 22% 18% Q2 2022 21% 17% Q1 2022 24% 18% Q4 2021 19% 23% Q3 2021 23% 15% Q2 2021 19% 14% Q1 2021 22% 15% Q4 2020 17% 23% Q3 2020 23% 14.40% Q2 2020 18.90% 15.80% Q1 2020 21.90% 13.60% Q4 2019 19.20% 21.30% Q2 2019 22.40% 12.30% Q1 2019 23.20% 10.90% Q4 2018 22.80% 12.80% Q3 2018 20.40% 13.40% Q2 2018 21.40% 12.20% Q1 2018 23.60% 15.50%
In the second quarter of 2023, Samsung was leading in the list of top smartphone vendors by shipments, accounting for 21% of the market. Its market share is 4.0% higher than Apple, which ranks second in smartphone shipments.
In the last recent quarters, Samsung peaked in the first quarter of 2022, with a share of around 24% of smartphone shipments.
Since 2019, shipments for Apple devices have consistently outperformed Samsung every fourth quarter, but Samsung always regained the top spot every first quarter.
Samsung Electronics Revenue
Samsung Electronics, the Samsung subsidiary that manufactures consumer electronics, generated a revenue of 76.78 trillion KRW or approximately 58 billion USD in the third quarter of 2022. It is considered to be one of the biggest manufacturing companies, along with Apple.
Samsung Electronics’ mobile communications segment, which houses the Android phones and wearable product lines, accounted for 23.30 billion USD of the company’s overall revenue in the fourth quarter of 2021, an increase of 0.4 billion USD from the previous quarter.
Samsung Electronics Revenue Per Year (2005-2022)
Annual Revenue of Samsung Electronics (2005-2022)
| Year | Revenue in South Korean Won | Revenue in US Dollars |
|---|---|---|
| 2022 | 302.23 trillion | 234.08 billion |
| 2021 | 279.60 trillion | 216.56 billion |
| 2020 | 236.81 trillion | 200.61 billion |
| 2019 | 230.40 trillion | 206.21 billion |
| 2018 | 243.77 trillion | 218.17 billion |
| 2017 | 239.58 trillion | 222.81 billion |
| 2016 | 201.87 trillion | 187.74 billion |
| 2015 | 200.65 trillion | 186.60 billion |
| 2014 | 206.21 trillion | 191.78 billion |
| 2013 | 228.69 trillion | 212.68 billion |
| 2012 | 201.10 trillion | 187.02 billion |
| 2011 | 165 trillion | 153.45 billion |
| 2010 | 154.63 trillion | 134.08 billion |
| 2009 | 136.32 trillion | 118.20 billion |
| 2008 | 121.29 trillion | 105.17 billion |
| 2007 | 98.51 trillion | 85.41 billion |
| 2006 | 85.43 trillion | 74.07 billion |
| 2005 | 80.63 trillion | 69.91 billion |
- Data Table
-
Annual Revenue of Samsung Electronics (2005-2022)
Year Revenue in South Korean Won Revenue in US Dollars 2022 302.23 trillion 234.08 billion 2021 279.60 trillion 216.56 billion 2020 236.81 trillion 200.61 billion 2019 230.40 trillion 206.21 billion 2018 243.77 trillion 218.17 billion 2017 239.58 trillion 222.81 billion 2016 201.87 trillion 187.74 billion 2015 200.65 trillion 186.60 billion 2014 206.21 trillion 191.78 billion 2013 228.69 trillion 212.68 billion 2012 201.10 trillion 187.02 billion 2011 165 trillion 153.45 billion 2010 154.63 trillion 134.08 billion 2009 136.32 trillion 118.20 billion 2008 121.29 trillion 105.17 billion 2007 98.51 trillion 85.41 billion 2006 85.43 trillion 74.07 billion 2005 80.63 trillion 69.91 billion
Key Stats:
- In 2021, Samsung Electronics’ revenue was estimated to be around 279.60 trillion KRW, or approximately 244.39 billion USD. It represents an increase of more than 42 trillion KRW from 2020 and more than 49 trillion KRW from 2019.
- Samsung’s revenue officially surpassed 200 trillion KRW in 2012. Before that year, the company’s revenue stood at 165 trillion KRW or about 153.45 million USD.
Samsung Electronics Revenue by Region
North and South America accounted for 35% of Samsung’s revenue in 2021. Europe accounted for 18% of the company’s revenue in the same year, with China and Korea generating 16%. Asia and Africa contributed the least, generating only 15% of the company’s revenue.
Revenue of Samsung's Mobile Communications Segment
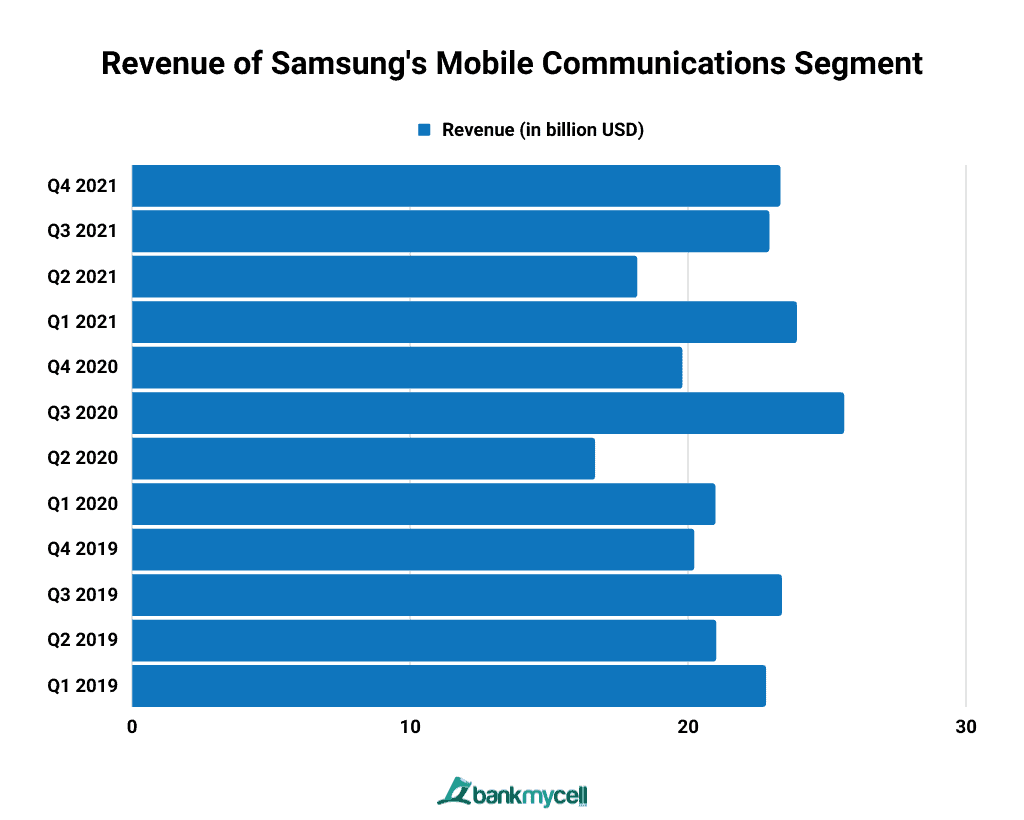
Samsung’s revenue for its mobile communications segment is approximately 23.30 billion USD as of the fourth quarter of 2021, an increase of 0.4 billion USD from the previous quarter.
Samsung's Mobile Communications Segment Revenue
| Quarter | Revenue |
|---|---|
| Q4 2021 | 23.30 billion USD |
| Q3 2021 | 22.90 billion USD |
| Q2 2021 | 18.15 billion USD |
| Q1 2021 | 23.89 billion USD |
| Q4 2020 | 19.77 billion USD |
| Q3 2020 | 25.59 billion USD |
| Q2 2020 | 16.63 billion USD |
| Q1 2020 | 20.96 billion USD |
| Q4 2019 | 20.20 billion USD |
| Q3 2019 | 23.35 billion USD |
| Q2 2019 | 20.99 billion USD |
| Q1 2019 | 22.78 billion USD |
- Data Table
-
Samsung's Mobile Communications Segment Revenue
Quarter Revenue Q4 2021 23.30 billion USD Q3 2021 22.90 billion USD Q2 2021 18.15 billion USD Q1 2021 23.89 billion USD Q4 2020 19.77 billion USD Q3 2020 25.59 billion USD Q2 2020 16.63 billion USD Q1 2020 20.96 billion USD Q4 2019 20.20 billion USD Q3 2019 23.35 billion USD Q2 2019 20.99 billion USD Q1 2019 22.78 billion USD - Data Graphic
-

Since 2019, the mobile communications segment recorded its lowest revenue in the second quarter of 2020, when it registered a loss of more than 4 billion USD from the previous quarter. Since 2020, the company’s mobile communications segment has seen an upward and downward trend, with the first quarter of 2020 starting strong at 20.96 billion USD, only to drop by more than 4 billion USD the next quarter.
Mobile Device Revenue Market Share: Samsung vs. Apple
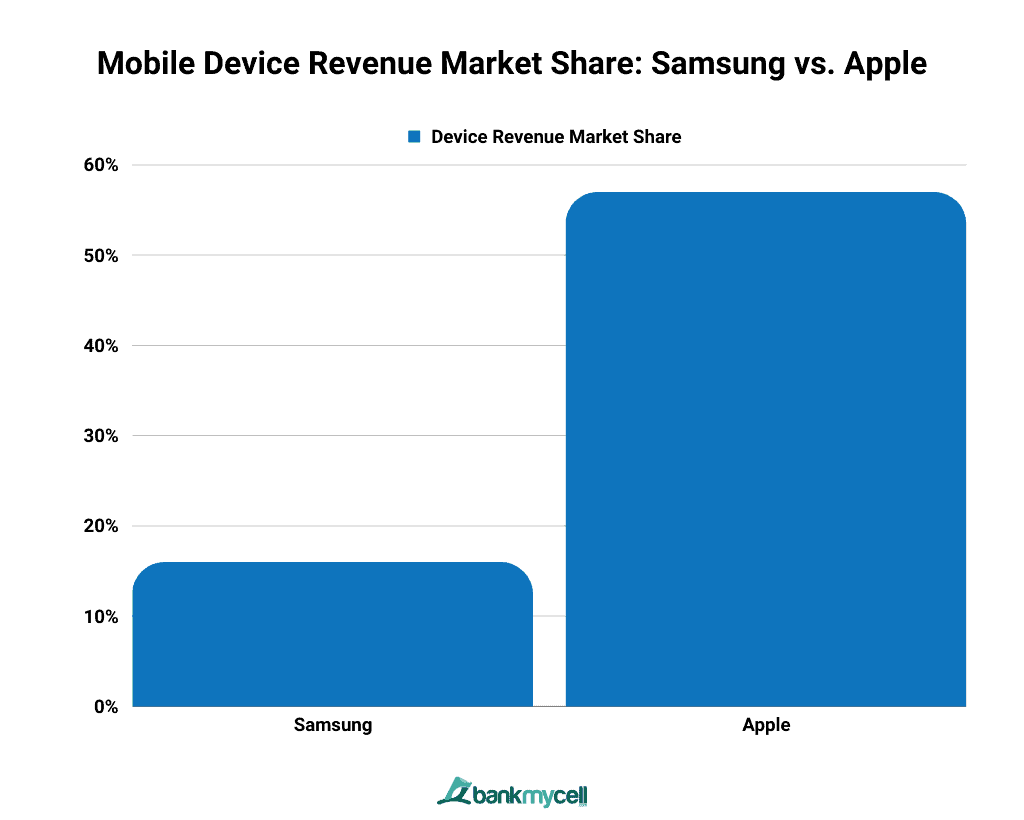
Samsung and Apple have consistently led the mobile phone market revenue from 2017 to 2024. In 2022, Samsung held approximately 16.1% of the market, while Apple held around 57.4%.
Samsung vs. Apple's Mobile Device Revenue Market Share
| Brand | Market Share |
|---|---|
| Samsung | 16.10% |
| Apple | 57.40% |
- Data Table
-
Samsung vs. Apple's Mobile Device Revenue Market Share
Brand Market Share Samsung 16.10% Apple 57.40% - Data Graphic
-

Key Stats:
- By the end of the year in June 2017, Samsung’s global mobile device revenue share at 24.5% was behind Apple by 20.4%. By 2018, with Apple was still leading Samsung by around 30% difference.
- In the previous five years, Samsung’s lowest mobile device revenue on the global smartphone market was around the year ending March 2018, when it recorded a revenue share of only 19%.
How Many Samsung Phone Users Are There?
The total number of Samsung smartphones on the market is approximately 1.033 billion. Samsung has a market share of 24.25% in 2024 and is one of the leading smartphone brands in the world.
What Percentage of People Have Samsung Phones?
Out of the 7.41 billion smartphone users in the world for 2024, around 1.033 billion use Samsung Galaxy phones. That means that around 14% of smartphone users worldwide use a Samsung Galaxy.
Percentage of Samsung Users vs. iPhone
While 14.09% of smartphone users worldwide use Samsung Galaxy, iPhone users account for approximately 20%, or approximately 1.46 billion people.