How Many Apps In Google Play Store? (2025)


Google Play App Statistics
With 8.93 million mobile apps developed by app developers, it is clear that the mobile app industry is thriving and becoming increasingly important in our lives.
Apps for our mobile devices are available in a variety of app stores. But first, let us look at Google Play statistics, such as how many apps are in the Google Play Store, its app revenue worldwide, the growth of Google Play over time, and so on.
Editors Picks:
- How Many Google Apps Are There? It is estimated that the Google Play Store will have 3.95 million mobile apps accessible for Android users to download in 2024.
- Google Play App Revenue Statistics: Google Play Store is expected to generate $58.1 billion in revenue from apps and games in the year 2024.
- Most Popular App Category on Google Play: The gaming category is the most popular in the Google Play Store, with a 13.80% share of all available apps. It accounts for $31.3 billion for the total app revenue of the Google Play Store in 2022.
- Largest App on Google Play: TikTok is the most downloaded app in Google Play Store today, with 672 million total downloads.
- Google Play Free Apps: 3.442 million (or 96.9%) are free Android apps, while over 110 thousand (or 3.1%) are paid apps in Google Play Store. Free apps generate 98% of Google Play Store revenue.
How Many Apps are On the Play Store?
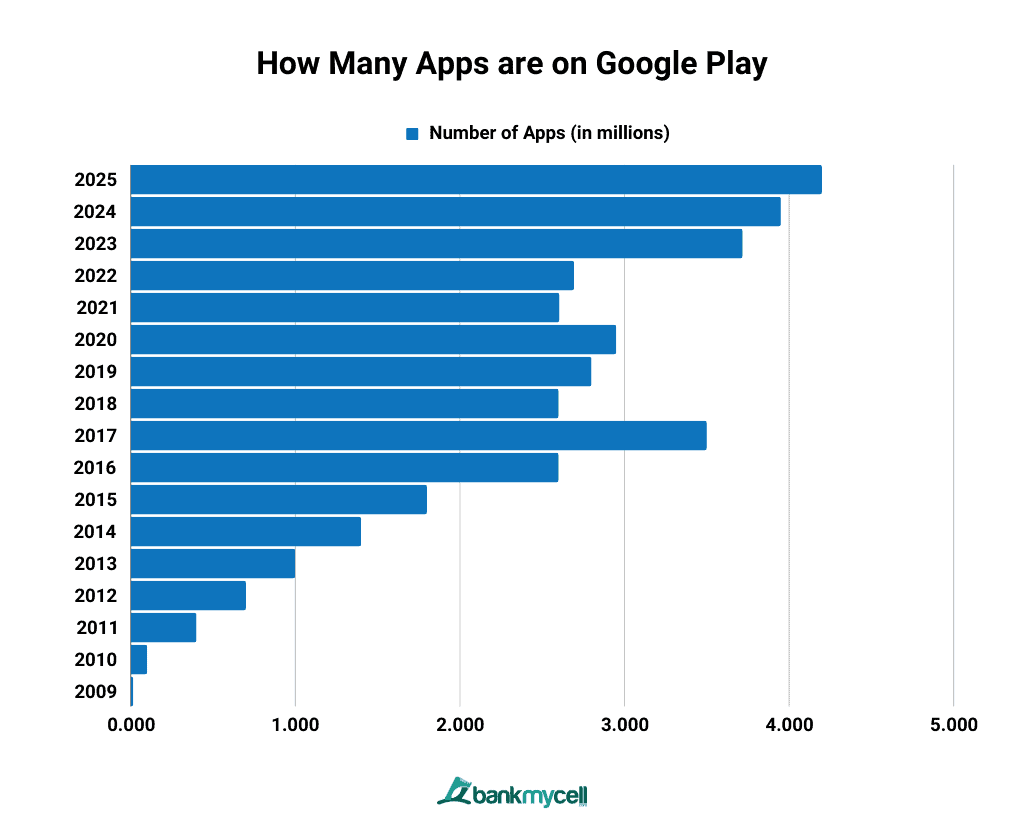
Google Play, an Android devices app store, leads the app store market. It is expected that you will be able to download around 3.95 million applications on the store in 2024. Its rival Apple App Store is expected to have around 1.83 million iPhone apps available in the same year. Despite having more apps, the Google Play Store generates less revenue from its apps and games compared to the Apple App Store. During the second quarter of 2023, Google Play generated US $11.8 billion, while the Apple App Store generated US $21.8 billion.
Android App Stores
Aside from the Google App Store, Chinese manufacturers also created several Android-based app stores, with Huawei AppGallery leading the way with 44% of the app market. Other China app stores are Tencent, 360 Mobile Assistant, Xiaomi App Store, Baidu Mobile Assistant, OPPO App Store, Sogou Mobile Assistant, and PP Mobile Assistant.
How Many Apps on Google Play (2009-2025)
| Year | Number of Apps (in millions) |
|---|---|
| 2025* | 4.200 |
| 2024* | 3.950 |
| 2023 | 3.718 |
| 2022 | 2.694 |
| 2021 | 2.605 |
| 2020 | 2.95 |
| 2019 | 2.8 |
| 2018 | 2.6 |
| 2017 | 3.5 |
| 2016 | 2.6 |
| 2015 | 1.8 |
| 2014 | 1.4 |
| 2013 | 1 |
| 2012 | 0.7 |
| 2011 | 0.4 |
| 2010 | 0.1 |
| 2009 | 0.016 |
- Data Table
-
Year Number of Apps (in millions) 2025* 4.200 2024* 3.950 2023 3.718 2022 2.694 2021 2.605 2020 2.95 2019 2.8 2018 2.6 2017 3.5 2016 2.6 2015 1.8 2014 1.4 2013 1 2012 0.7 2011 0.4 2010 0.1 2009 0.016 - Data Graphic
-

Google Play Store has grown from 16 thousand apps in 2009 to 3.718 million apps in 14 years, a huge increase of more than 3.7 million. The platform was first released as Android Market in October 2008 and now serves as an official app store for the Android operating system.
Users can rate apps downloaded to their mobile device in this app store, which allows app publishers or developers to improve or develop new apps.
Growth of Mobile Apps Available in Google Play Store
Google Play Store is estimated to grow by a 6.23% increase in mobile app availability in 2024, with apps increasing from 3.718 million in 2023 to 3.95 million in 2024.
According to a 2023 report, more than 70 thousand new apps are released monthly in the Google Play Store worldwide.
Google Play Store Revenue
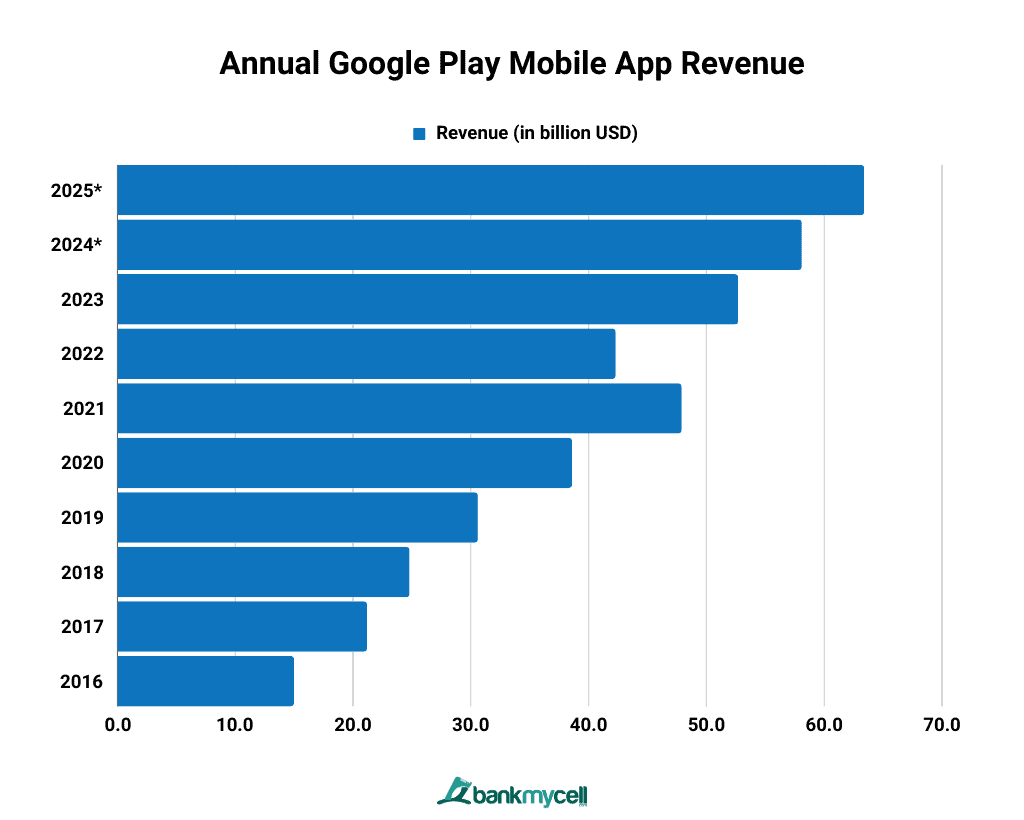
Google Play Store is expected to generate US $58.1 billion in revenue from apps and games in 2024, a $5.4 billion increase from the previous year. Its main competitor, the Apple App Store, is expected to generate US $111.88 billion from apps and games in the same year.
Google Play games generated US $31.3 billion in 2022, falling US $6 billion from the previous year. It is still lagging behind Apple App Store, which took US$ 50 billion in revenue for its gaming apps in the same year.
Quarterly Google Play Mobile App Revenue
| Quarter | Revenue (in billion USD) |
|---|---|
| Q2 2023 | 11.8 |
| Q1 2023 | 11.4 |
| Q4 2022 | 10.6 |
| Q3 2022 | 10.4 |
| Q2 2022 | 10.6 |
| Q1 2022 | 10.7 |
| Q4 2021 | 12.4 |
| Q3 2021 | 12.1 |
- Data Table
-
Quarter Revenue (in billion USD) Q2 2023 11.8 Q1 2023 11.4 Q4 2022 10.6 Q3 2022 10.4 Q2 2022 10.6 Q1 2022 10.7 Q4 2021 12.4 Q3 2021 12.1 - Data Graphic
-

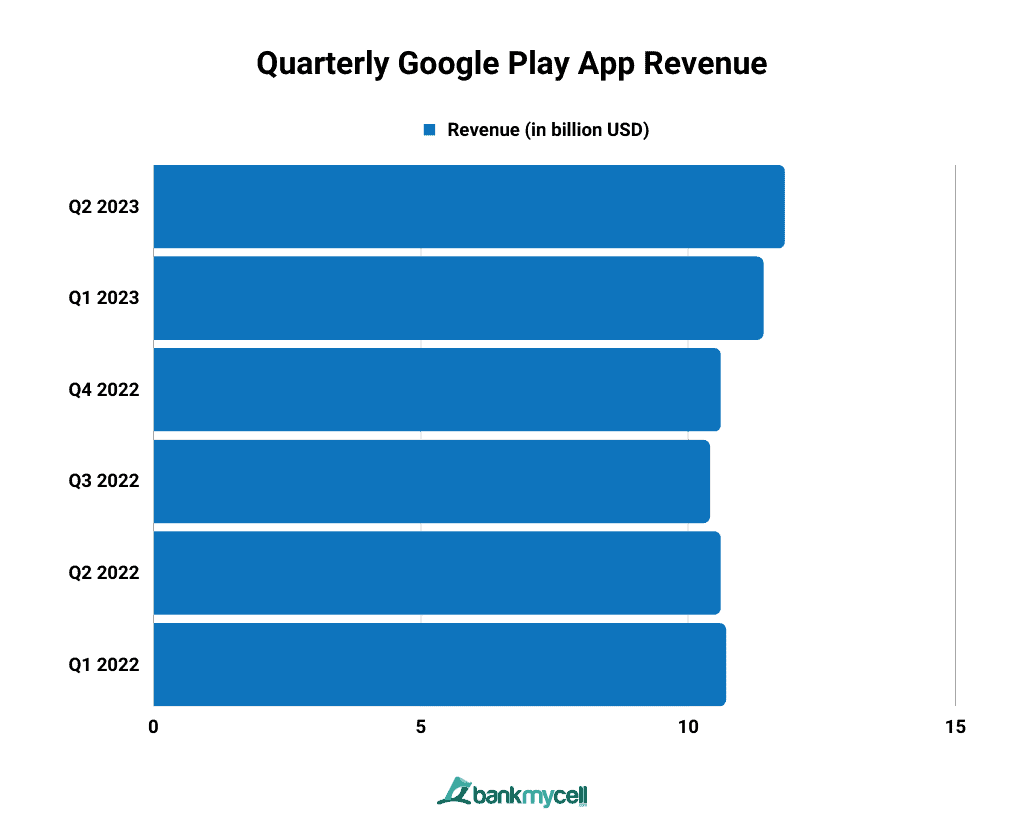
Google Play revenue from apps and games was $11.8 billion in Q2 2023, showing a $1.2 billion increase from the 4th quarter of 2022. Its highest quarterly revenue was $12.4 billion in Q4 2021.
Annual Google Play Mobile App Revenue
| Year | Revenue (in billion USD) |
|---|---|
| 2025* | 63.4 |
| 2024* | 58.1 |
| 2023* | 52.7 |
| 2022 | 42.3 |
| 2021 | 47.9 |
| 2020 | 38.6 |
| 2019 | 30.6 |
| 2018 | 24.8 |
| 2017 | 21.2 |
| 2016 | 15 |
- Data Table
-
Year Revenue (in billion USD) 2025* 63.4 2024* 58.1 2023* 52.7 2022 42.3 2021 47.9 2020 38.6 2019 30.6 2018 24.8 2017 21.2 2016 15 - Data Graphic
-

The trend for the annual Google Play app and game revenue has been going upward from 2016 to 2021. It saw its first decline in 2022, however, when it garnered US$ 5.6 billion less in revenue or an 11.9% decline from 2021.
Most Popular App Categories in Google Play Worldwide 2024
The most popular category in the Google Play Store is gaming apps, with a 13.80% share of all available apps. It was responsible for US$31.3 billion or 74% of Google Play Store’s app revenue in 2022
In this section, you will learn about the most popular Google Play App Categories today by their share of available apps.
Top 10 Most Popular App Categories by Share of Available Apps
| App Category | App Category Share of Available Apps (%) |
|---|---|
| Games | 13.8 |
| Education | 10.47 |
| Business | 7.11 |
| Tools | 6.46 |
| Entertainment | 5.5 |
| Music & Audio | 5.04 |
| Food & Drink | 4.83 |
| Shopping | 4.74 |
| Lifestyle | 4.53 |
| Productivity | 4.16 |
- Data Table
-
App Category App Category Share of Available Apps (%) Games 13.8 Education 10.47 Business 7.11 Tools 6.46 Entertainment 5.5 Music & Audio 5.04 Food & Drink 4.83 Shopping 4.74 Lifestyle 4.53 Productivity 4.16 - Data Graphic
-

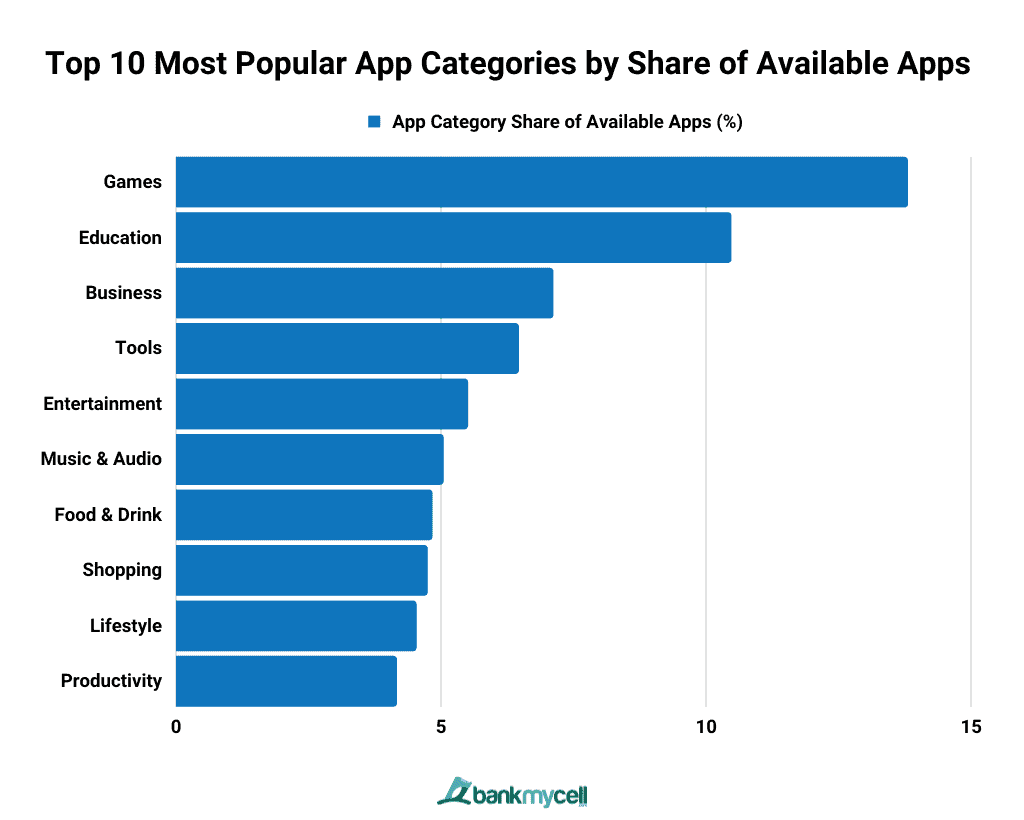
The most popular category in the Google Play Store is gaming apps, with a 13.80% share of all available apps. It is up by 3.33% compared to the second-largest app category, Education. Coin Master, Candy Crush Saga, Roblox, Pokemon GO, and PUBG Mobile are the games listed in the top 10 leading Android games in the Google Play Store world.
The business category ranks third in the largest app categories with 7.11%, followed by tools (6.46%), entertainment apps (5.50%), music and audio (5.04%), food and drink apps (4.83%), shopping apps (4.74%), lifestyle apps (4.53%), and productivity apps (4.16%).
Despite ranking fourth, the tools category saw a nearly 50% increase in downloads worldwide in 2021 compared to the last year.
Most Popular Apps in Google Play 2024
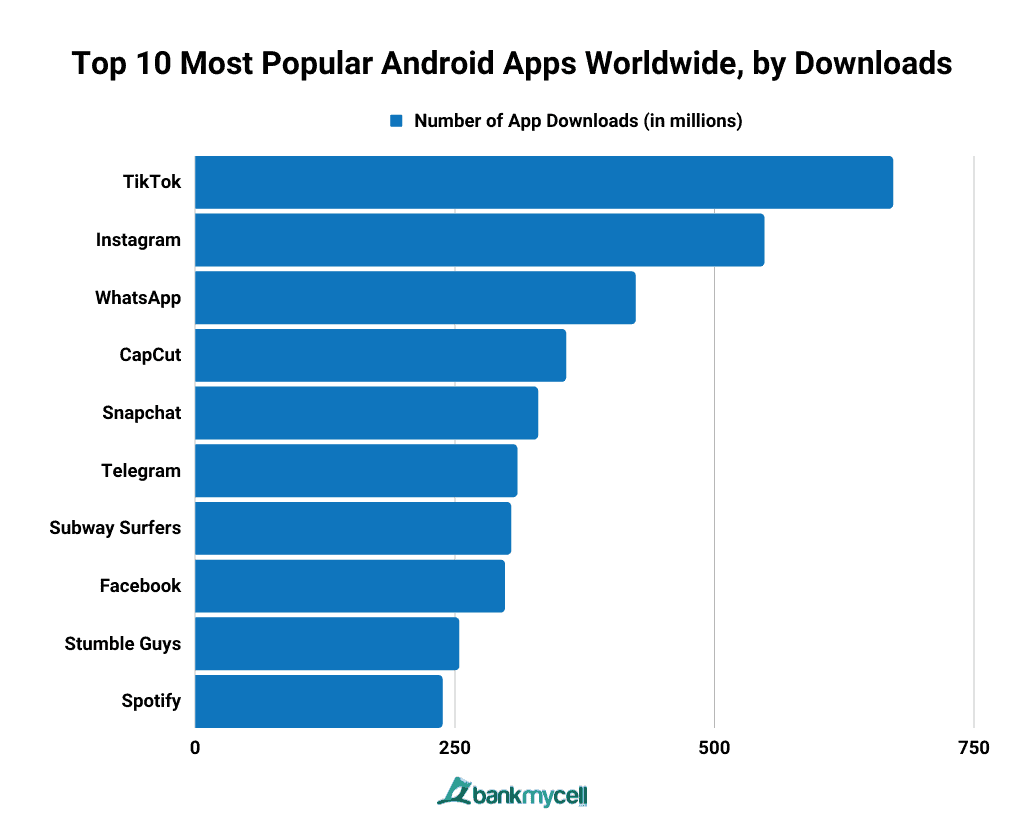
TikTok is today’s most popular Android app, with 672 million downloads. It is followed by Instagram, WhatsApp, CapCut, and Snapchat.
In this section, you will know what’s the most popular Google Play app right now based on the download count and revenue, along with some facts for you.
Top 10 Most Popular Android Apps Worldwide, by Downloads
| Year | Number of App Downloads (in millions) |
|---|---|
| TikTok | 672 |
| 548 | |
| 424 | |
| CapCut | 357 |
| Snapchat | 330 |
| Telegram | 310 |
| Subway Surfers | 304 |
| 298 | |
| Stumble Guys | 254 |
| Spotify | 238 |
- Data Table
-
Year Number of App Downloads (in millions) TikTok 672 Instagram 548 WhatsApp 424 CapCut 357 Snapchat 330 Telegram 310 Subway Surfers 304 Facebook 298 Stumble Guys 254 Spotify 238 - Data Graphic
-

TikTok is today’s most popular Android app, which reached 672 million downloads. It is a mobile app for sharing video content that rose throughout the pandemic, achieving 980.7 million first-time installations in 2020. However, it dropped by 24.54% in 2021.
The mobile communication platforms, Instagram and WhatsApp, ranked second and third, reaching 548 million and 424 million downloads, respectively. In comparison, Snapchat and Telegram ranked fifth and sixth with 330 million and 310 million downloads, respectively.
CapCut, an app that allows users to edit videos, has 357 million app downloads. Subway Surfers and Stumble Guys are the only mobile games to make the top apps list. Facebook was ranked eighth, while Spotify was ranked last with 238 million downloads.
Top 10 Most Popular Android Apps in the US, by Downloads
| App | Total App Downloads (in millions) |
|---|---|
| TikTok | 3.13 |
| Temu: Shop Like a Billionaire | 2.2 |
| 2.13 | |
| McDonald's | 1.55 |
| WhatsApp Messenger | 1.55 |
| SHEIN | 1.52 |
| Cash App | 1.47 |
| 1.45 | |
| Door Dash | 1.24 |
| Snapchat | 1.19 |
- Data Table
-
App Total App Downloads (in millions) TikTok 3.13 Temu: Shop Like a Billionaire 2.2 Instagram 2.13 McDonald's 1.55 WhatsApp Messenger 1.55 SHEIN 1.52 Cash App 1.47 Facebook 1.45 Door Dash 1.24 Snapchat 1.19 - Data Graphic
-

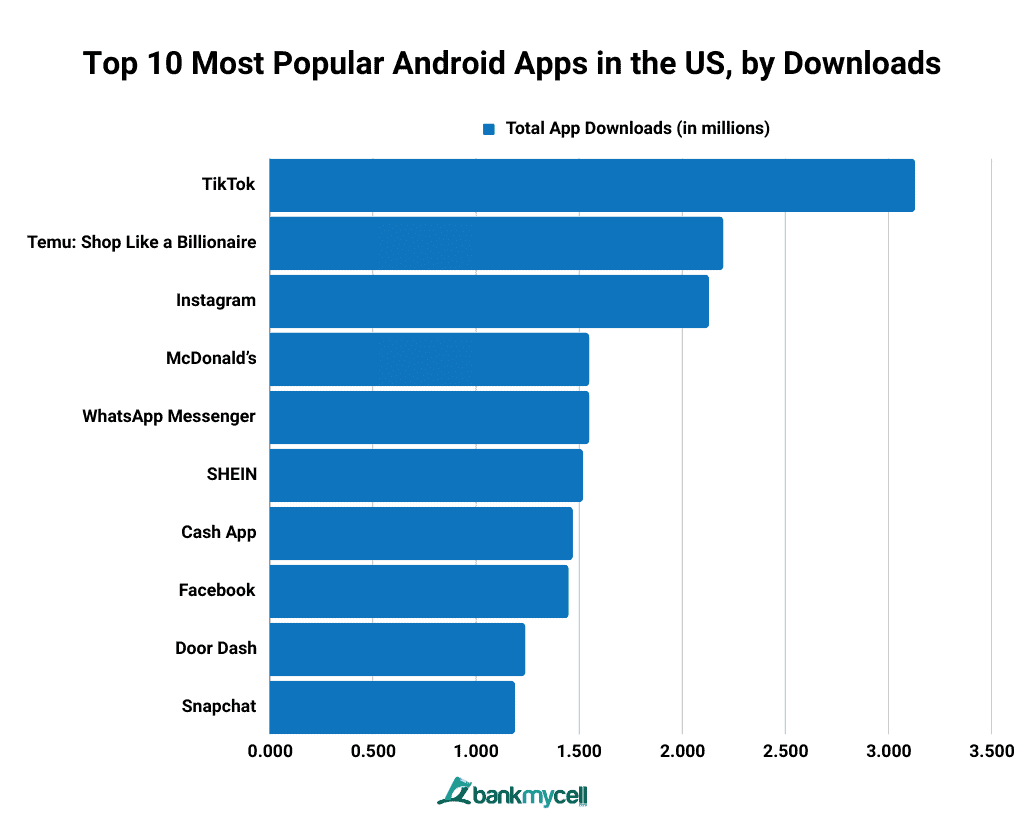
Filto: Video Filter Editor, an editing app, is the most popular Android app in the United States, reaching 1.641 million downloads in 2022. TikTok is trailing behind with 1.613 million total app downloads. It is also the second most downloaded Android app in revenue, generating US $14.11 million.
Candy Crush Saga is the most profitable game in the Google Play Store in the United States, earning US $23.42 million from users. TikTok follows, generating US $14.11 million in revenue.
Google Play Free VS. Paid Apps
In this section, you will learn how many free vs paid apps on Google Play – the distribution and revenue share of the platform.
What Is The Distribution of Free vs. Paid Apps on the Google Play Store?
With 3.553 million mobile apps available in the Google Play Store, 3.442 million (or 96.9%) are free to download, while over 110 thousand (or 3.1%) are paid apps. The vast majority of the platform’s apps can be downloaded for free. Thus the company employs monetization strategies or business models like in-app purchases and ads-based profit to generate sufficient revenue.
What is the Revenue Share of Free Apps in Google Play?
Free apps generate 98% of Google Play Store revenue. In-app purchases account for 48.2% of total mobile app earnings and is the most commonly-used monetization model.