Smartphone Brand Loyalty Statistics (2019)
Online Cell Phone Trade-In Market

BankMyCell is a cell phone trade-in website, since October 2018, we have accumulated data from resale savvy Americans to understand upgrade cycle trends. We collected the consumer’s current device branding as they went to trade-in or value their old smartphones, verifying it was the succeeding activation of their old device.
Profiling user trends in this way not only helps provide a better customer journey by predicting the phone brand consumers are likely to have next, but as you’ll see below, it gives some sensational insights into brand retention in the online trade-in market.
Key Trade-in Statistics
- Only 10.8% of HTC respondents stayed loyal, with 32.1% heading to Samsung, 17.1% to Apple.
- HTC was the only popular brand that didn’t retain the majority of their fans, ranking 4th in its brand switch data.
- Only 9.6% HTC U12 owners remained with HTC, 37.1% headed to a Samsung device.
- Apple had 74.6% iPhone trade-in brand loyalty, with 12.8% heading to Samsung, 5.3% to LG.
- Only 65.9% iPhone XS owners remained with Apple, 18.6% headed to a Samsung device.
- Samsung had 63.9% trade-in brand loyalty, with 17% heading to Apple.
- Google had 51.0% trade-in brand loyalty, with 13.2% heading to Samsung.
- Google stands out as the brand that had the least owners going to Apple at 10.1%.
- All other non-Apple brands consistently had between 17.0% – 17.5% getting an iPhone after.
SMARTPHONE BRAND LOYALTY OVERVIEW
PHONE TRADE-IN MARKET 2019
On the 17th July 2019, we released iPhone data that was tracked from Oct ’18 to Jun ’19 to look at all the Apple-specific trends in the online trade-in market. Here we look at the data from 15th Jan – 15th July 2019; all brands in this study were analyzed during the same period.
Smartphone Brand Loyalty Statistics (Online Trade-in Market 2019)
The chart below provides a visual overview of brand retention at trade-in for each of these popular smartphone brands. It is no surprise that Apple and Samsung stand out as the manufacturers with the highest brand retention. Consumers that were looking to sell their HTC phone were highlighted as having the most evenly distributed brand switch data between the pack.
- Apple had 74.6% iPhone trade-in brand loyalty, with 12.8% heading to Samsung, 5.3% to LG.
- Samsung had 63.9% trade-in brand loyalty, with 17% heading to Apple, 8% to LG.
- Google had 51.0% trade-in brand loyalty, with the lowest volume heading to Apple at 10.1%.
- LG, Motorola and HTC all fell below 41% brand loyalty at trade-in.
- Only 10.8% of HTC respondents stayed loyal, with 32.1% heading to Samsung, 17.1% to Apple.
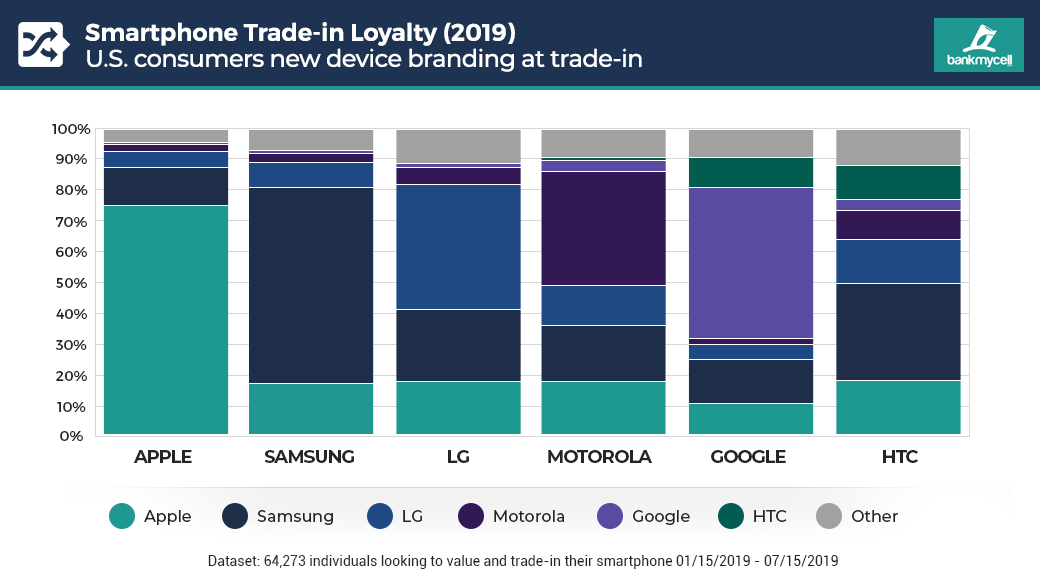
- 74.6% iPhone trade-in: Samsung 12.8% | LG 5.3% | Motorola 2.3% | Google 1.1% | HTC 0.5%
- 63.9% Samsung trade-in: Apple 17.0% | LG 8.0% | Motorola 3.1% | Google 1.7% | HTC 0.4%
- 51.0% Google trade-in: Samsung 13.2% | HTC 12.0% | Apple | 10.1% | LG 6.2% | Motorola 2.6%
- 40.7% LG trade-in: Samsung 23.5% | Apple 17.5% | Motorola 5.4% | Google 1.9% | HTC 0.3%
- 37.2% Motorola trade-in: Samsung 18.5% | Apple 17.2% | LG 13.2% | Google 4.2% | HTC 1.2%
- 10.8% HTC trade-in: Samsung 32.1% | Apple 17.1% | LG 14.7% | Motorola 9.6% | Google 3.4%
SMARTPHONE LOYALTY BY BRAND
PHONE TRADE-IN MARKET 2019
RANKED #1
iPhone Brand Loyalty Statistics (Online Trade-in Market 2019)
Key findings:
- Apple had 74.6% trade-in brand loyalty, ranked 1st overall so far in 2019.
- 12.8% of iPhone owners using our site moved to rival Samsung.
- 25.4% of iPhone owners moved to an Android/RIM/Windows device.
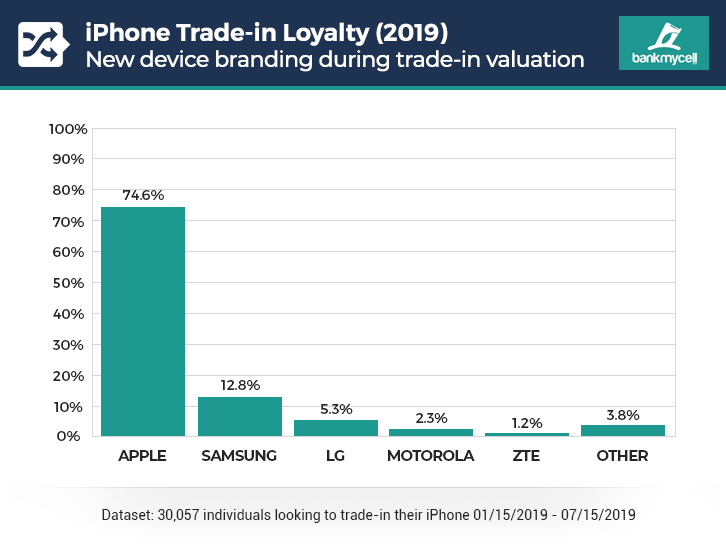
- Apple – 74.6%
- Samsung -12.8%
- LG – 5.3%
- Motorola – 2.3%
- ZTE 2%
- Google – 1.1%*
- Alcatel – 1.0%*
- HTC – 0.5%*
- OnePlus – 0.3%*
- Huawei – 0.2%*
- Other – 0.8%
*Entries merged into ‘other’ in the chart above
RANKED #2
Samsung Brand Loyalty Statistics (Online Trade-in Market 2019)
Key findings:
- Samsung had 63.9% trade-in brand loyalty, ranked 2nd overall.
- 17% of Samsung owners moved to an iOS device.
- 83% of Samsung owners had upgraded to an Android/RIM/Windows device.
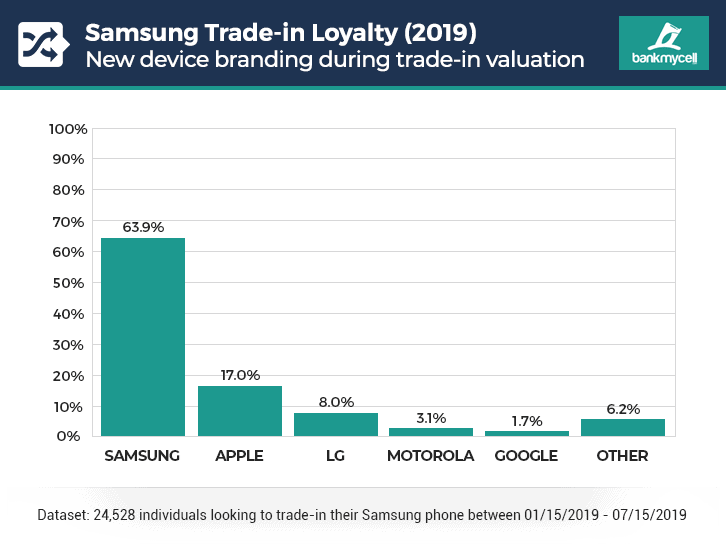
- Samsung – 63.9%
- Apple – 17.0%
- LG – 8.0%
- Motorola – 3.1%
- Google – 1.7%
- ZTE – 1.4%*
- Alcatel – 1.4%*
- OnePlus – 1.0%*
- HTC – 0.4%*
- Huawei – 0.4%*
- Other – 1.6%
*Entries merged into ‘other’ in the chart above
RANKED #3:
Google Brand Loyalty Statistics (Online Trade-in Market 2019)
Key findings:
- Google had 51.0% trade-in brand loyalty, ranked 3rd overall.
- 10.1% of Google smartphone owners moved to an iOS device (the lowest non-Apple switch data).
- 89.9% of Google smartphone owners had upgraded to an Android/RIM/Windows device.
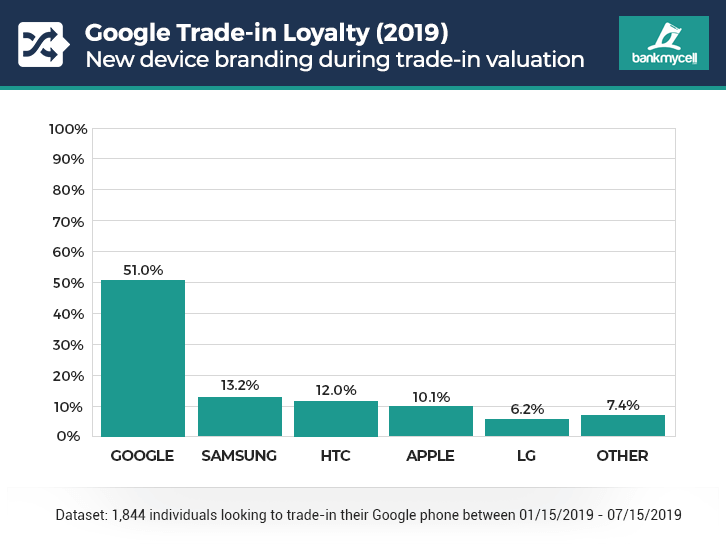
- Google – 51.0%
- Samsung – 13.2%
- HTC – 12.0%
- Apple – 10.1%
- LG – 6.2%
- Motorola – 2.6%*
- OnePlus – 1.7%*
- ZTE – 1.2%*
- Asus – 0.4%*
- Alcatel – 0.3%*
- Other – 1.2%
*Entries merged into ‘other’ in the chart above
RANKED #4
LG Brand Loyalty Statistics (Online Trade-in Market 2019)
Key findings:
- LG had 40.7% trade-in brand loyalty, ranked 4th overall.
- 17.5% of LG owners moved to an iOS device.
- 82.5% of LG owners had upgraded to an Android/RIM/Windows device.
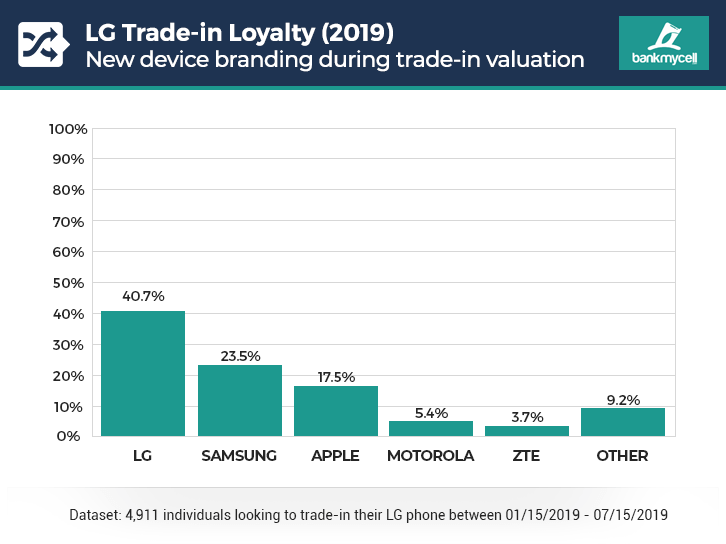
- LG – 40.7%
- Samsung – 23.5%
- Apple – 17.5%
- Motorola – 5.4%
- ZTE – 3.7%
- Alcatel – 3.3%*
- Google – 1.9%*
- Huawei – 0.7%*
- Essential – 0.4%*
- HTC – 0.3%*
- Other – 2.6%
*Entries merged into ‘other’ in the chart above
RANKED #5
Motorola Brand Loyalty Statistics (Online Trade-in Market 2019)
Key findings:
- Motorola had 37.9% trade-in brand loyalty, ranked 5th out of all the brands.
- 17.2% of Motorola owners moved to an iOS device.
- 82.8% of Motorola owners had upgraded to an Android/RIM/Windows device.
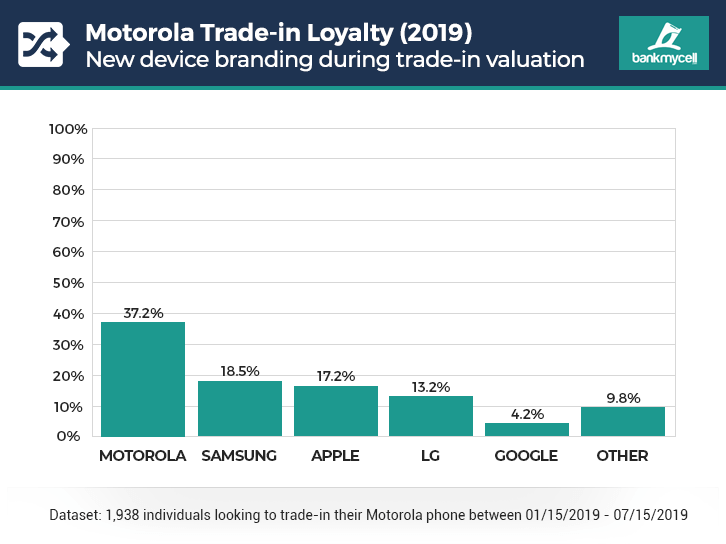
- Motorola – 37.2%
- Samsung – 18.5%
- Apple – 17.2%
- LG – 13.2%
- Google – 4.2%
- ZTE – 2.0%*
- Alcatel – 1.9%*
- HTC – 1.2%*
- Amazon – 1.0%*
- Lenovo – 0.8%*
- Other – 2.9%
*Entries merged into ‘other’ in the chart above
RANKED #6
HTC Brand Loyalty Statistics (Online Trade-in Market 2019)
Key findings:
- HTC had 10.8% trade-in brand loyalty, ranked 6th out of all the brands.
- 17.1% of HTC owners moved to an iOS device.
- 82.9% of HTC owners had upgraded to an Android/RIM/Windows device.
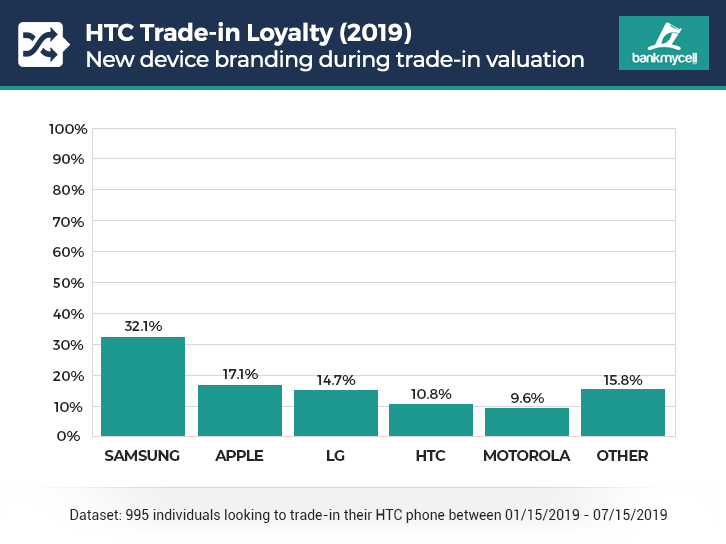
- Samsung – 32.1%
- Apple – 17.1%
- LG – 14.7%
- HTC – 10.8%
- Motorola – 9.6%
- ZTE – 5.7%*
- Alcatel – 3.6%*
- Google – 3.4%*
- Huawei – 1.1%*
- Asus – 0.4%*
- Other – 1.5%
*Entries merged into ‘other’ in the chart above
SMARTPHONE LOYALTY BY DEVICE
PHONE TRADE-IN MARKET 2019
Device Specific Brand Loyalty During Online Trade-in
Key findings:
- iPhone XS: 65.9% remained with Apple, 18.6% headed to a Samsung device
- iPhone X: 76.9% remained with Apple, 13.6% headed to a Samsung device
- Galaxy S9: 73.1% remained with Samsung, 12.2% headed to an Apple device
- Galaxy S8: 70.8% remained with Samsung, 15.1% headed to an Apple device
- LG G6: 45.7% remained with LG, 22.6% headed to a Samsung device
- Moto G6: 42.0% remained with Motorola, 22.0% headed to an Apple device
- Pixel 2 XL: 63.6% remained with Google, 11.0% headed to an Apple device
- HTC U12: 9.6% remained with HTC, 37.1% headed to a Samsung device
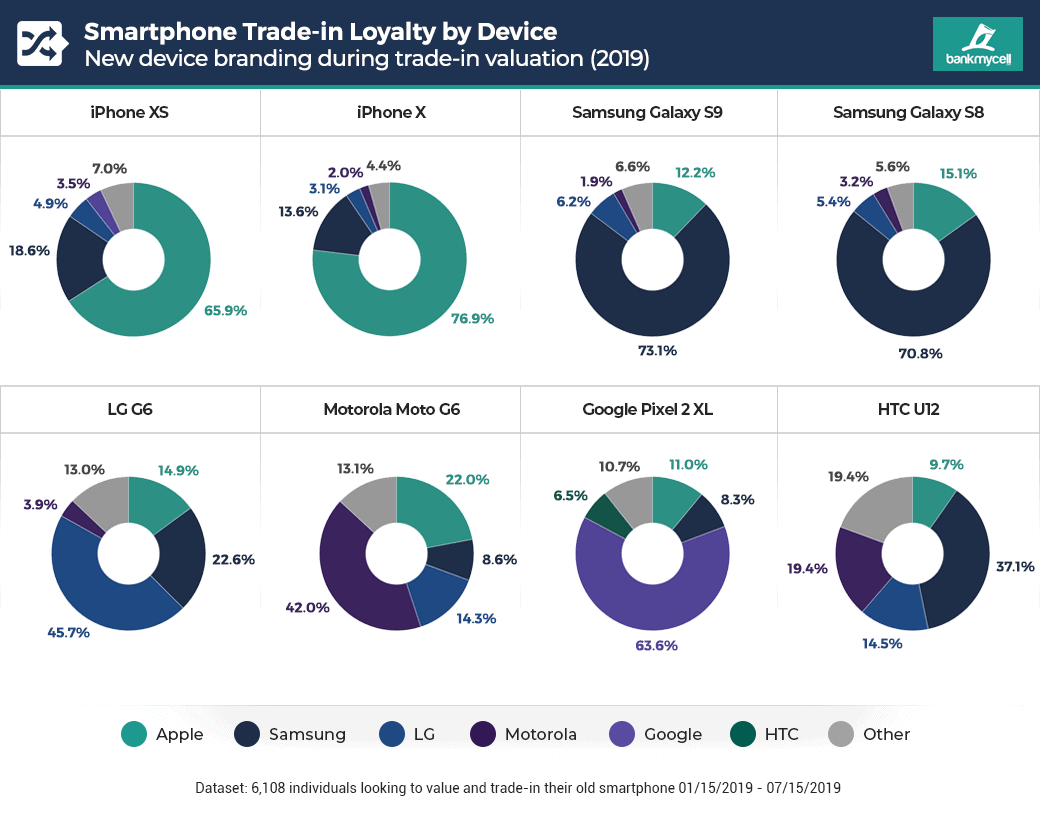
- iPhone XS: Apple 65.9% | Samsung 18.6% | LG 4.9% | Motorola 3.5% | Other 7.0%
- iPhone X: Apple 76.9% | Samsung 13.6% | LG 3.1% | Motorola 2.0% | Other 4.4%
- Galaxy S9: Apple 12.2% | Samsung 73.1% | LG 6.2% | Motorola 1.9% | Other 6.6%
- Galaxy S8: Apple 15.1% | Samsung 70.8% | LG 5.4% | Motorola 3.2% | Other 5.6%
- LG G6: Apple 14.9% | Samsung 22.6% | LG 45.7% | Motorola 3.9% | Other 13.0%
- Moto G6: Apple 22.0% | Samsung 8.6% | LG 14.3% | Motorola 42.0% | Other 13.1%
- Pixel 2 XL: Apple 11.0% | Samsung 8.3% | Google 63.6% | HTC 6.5% | Other 10.7%
- HTC U12: Apple 9.7% | Samsung 37.1% | LG 14.5% | Motorola 19.4% | Other 19.4%
METHODOLOGY
BankMyCell’s report is based on the collection of brand data for marketing material, with the goal knowing the next device a consumer has to offer trade-in prices at various stages of the upgrade cycle. Consumers valuing or trading in their old devices were asked what their current device branding was, and if it directly succeeded the model they’re valuing.
This sizable dataset gave us a unique insight into consumer upgrade patterns within the trade-in market.
Methodology:
- The dataset was based on 64,273 unique users looking to sell one of the 323 devices in our cell phone database
- Our online audience 62.4% millennials / 37.6% were 36-65+
- 60.7% female / 39.3% male gender split
- Users validated the new device was succeeding the previous device they were selling, previous activations were excluded from the data.
- The data runs from 01/15/19 – 07/15/19.
Disclosures:
- Regrettably, we could not use Huawei as the US ban caused the category to be disabled on the site, resulting in the data being limited and invalid in terms of its comparability.
- This report portrays a sample size of the US online trade-in market and does not represent the brand loyalty as a whole.
- The data is from our site and does not include own brand managed, carrier, instore, and other trade-in market routes.
- HTC was inactive on the site for catalog maintenance between 01/01/19 – 01/14/19, so the data runs from 01/15/19 – 07/15/19 for all brands in all the assets featured above.