2021-2022's Phone Depreciation Report
Operating Systems, Manufacturer & Device Price Trends

Phone Trade-in Report Introduction
In a market where the latest flagship smartphone can cost you up to $1,899, consumers heavily depend on carrier, store, and online trade-in services to support their upgrade cycle. However, the average consumer upgrading every 24.7 months should watch out – not every phone depreciates the same.
Through Jan 1st – Dec 31st in 2021, the cell phone trade-in website, BankMyCell, recorded buyback values from almost 500 popular phones hourly. Our annual trade-in market report uncovers which brands, operating systems, and particular smartphone series burn consumers’ cash the fastest!
Report Quick Links
Consumer-Focused Report Summary
Top 5 Standout Buyback Market Trends
Android Phones Drop Twice As Fast As iPhones (36 Months Post Release)
The data below shows is the average yearly depreciation from the device’s initial buyback price for used iOS or Android devices priced at $699 or over.
- Year 1-4 from release, the average yearly loss of a new iPhone is -14.80% of its original trade-in value, whereas Android devices lost -32.18%.
- After 4 years, iPhones will lose -47.49% of their initial buyback value, whereas flagship Android phones will lose -78.94% on average.
Below is the comparable yearly loss:
- Year 1: iPhone -13.83% VS. -32.06% Android.
- Year 2: iPhone -13.57% VS. -35.14% Android.
- Year 3: iPhone -11.30% VS. -27.09% Android.
- Year 4: iPhone -20.50% VS. -34.44% Android.
Learn More: Jump to data
Important: Our data excludes limited-time trade-in or upgrade promo campaigns from brands and carriers.
Upgrading to a Galaxy S22? iPhone vs. Galaxy S Value Loss Comparison
As the yearly iPhone and Galaxy S ranges often get analyzed head to head for sales and functionally, we decided to compare their buyback value data side by side as well.
- On average, the iPhone 12 range lost -13.83% of its buyback price through 2021, compared with the Samsung Galaxy S21 range at -23.72%.
- On average, the iPhone 11 range lost -10.72% of its buyback price through 2021, compared with the Samsung Galaxy S20 range at –35.61%.
- The Samsung Galaxy S21 Ultra was the only Galaxy S device with good price retention, only dropping -16.35% compared with the iPhone 12 Pro Max at -15.40%.
Important: Our data excludes limited-time trade-in or upgrade promo campaigns from brands and carriers.
Budget Android Devices Lose An Average Of -41.82% In 12 Months

We took all Android phones released at $399 or less and mapped out their yearly depreciation. The report showed that consumers would lose almost 60% of the value of the handset in the average 24-month upgrade cycle.
- Android devices priced at $399 or less at launch lose an average of -41.82% of their resale value in the first year, with -58.84% by year two, -71.57% year three, and -87.83% by year four.
- Samsung Galaxy A11 lost -94.13% in 2 years, from retailing at $179 in May 2019 to a trade-in value of $10.50 in Dec 2021.
- Google Pixel 3a lost -78.44% in 3 years, from retailing at $399 in May 2019 to a trade-in value of $86 in Dec 2021.
- Sony Xperia 10 lost -88.57% in 3 years, from retailing at $350 in Feb 2019 to a trade-in value of $40 in Dec 2021.
Important: Our data excludes limited-time trade-in or upgrade promo campaigns from brands and carriers.
Next-Gen Foldable Phones: A Consumer & BuyBack Store Nightmare

Most trade-in services refurbish and resell smartphones through their own or partnered phone recycle facilities. With Samsung charging $479 to repair the inner screen of a Galaxy Fold3, compared with $199 for a Galaxy S21 – this makes it tough for stores to offer consumers reasonable buyback prices.
- Galaxy Z Fold3 5G was released in August 2021 for $1,799, 5 months later its lost -$1,039 or -57.75% of its value
- Galaxy Z Fold2 5G was in the top 10 lists for overall depreciation and monetary value, with a 12-month loss of -$322.33, which is -42.34% of its price in Jan 2021
- Galaxy Z Flip3 launched in August 2021 for $999 and -53.60% less by December. The 2020 Galaxy Z Flip 5G also lost -37.50% of its value in 2021.
- Motorola RAZR 5G got released in September 2020 for $1,399; by December 2021, it had depreciated -84.34% in the trade-in market.
Important: Our data excludes limited-time trade-in or upgrade promo campaigns from brands and carriers.
Big Day One Trade-in Value Drops For Google Pixel & OnePlus Smartphones

Once they become used, the premium range of OnePlus and Google Pixel smartphones have significant drops in trade-in market value. The initial day one quotes are almost half the retail values. However, through the first year, they hold that price well.
- Pixel 6 Range (2021): The starting trade-in value was -49.25% less than its retail value; however, it only lost -4.79% from Oct-Dec 2021.
- Pixel 5 Range (2020): Similar to the pattern on the Pixel 6, the trade-in value loss for the entire of 2021 was only -3.17% – However, after release, it was worth -46.63% less than its retail price.
- OnePlus 9/9 Pro (2021): The starting trade-in value was –55.56% less than its retail value; however, it only lost an average of -4.28% from Mar-Dec 2021.
- OnePlus 8/8T (2020): The OnePlus 8T range lost the most value in 2021, with an average of -46.01% compared with the OnePlus 8 range losing -37.39%.
Important: Our data excludes limited-time trade-in or upgrade promo campaigns from brands and carriers.
iOS vs. Android Depreciation Rates
Price Drops by Operating System (4-Years)
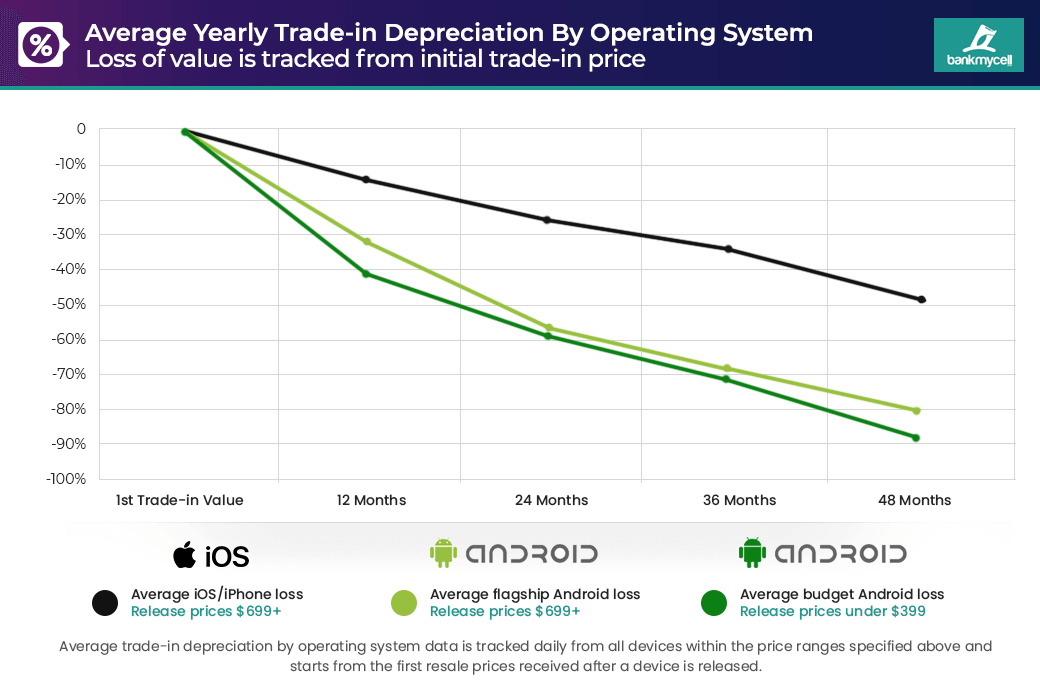
BankMyCell tracked hourly trade-in market quotes from multiple buyback vendors across 500 devices, including storage capacity options. The chart below shows the average yearly depreciation of iOS and Android smartphones, grouped via release price.
The tracked flagship Android VS iOS devices were priced at $699 and over at launch, and budget Androids are grouped at $399 and below.
As the chart shows, consumers with an iOS device can expect a comfortable trade-in return in the first 12-36 months of release – with iPhones only losing -33.95% of their original buyback value by the end of year three. By comparison, flagship Android devices lost an average of -67.87% in the same period, with year-on-year depreciation consistently averaging double the amount of an iPhone.
Consumers buying a budget Android device for $350 would most likely be worth less than $43 after 4 years.
iOS vs. Android: Average 4-year trade-in depreciation
iOS 4-year loss summary 2021:
- After 4 years, iPhones will lose -47.49% of their initial buyback value, on average.
- Over 48 months, the average yearly loss of an iPhone retailing at $699 or more is -14.80% of their original trade-in value.
- The lowest loss was -11.30%, and the largest was -20.50% in year four.
iPhone Buyback Value Depreciation (Example)
Using the data’s averages, if a consumer’s iPhone was valued at $850 for trade-in on day one, this is what it’s price decline would look like year-over-year.
Flagship Android 4-year loss summary 2021:
- After 4 years, flagship Android phones will lose -78.94% of their initial buyback value, on average.
- Over 48 months, the average yearly loss of a flagship Android phone retailing at $699 or more is -32.18% of its original trade-in value.
- The lowest loss was -27.09%, and the largest was –35.14% in year two.
Flagship Android Buyback Value Depreciation (Example)
Using the data’s averages, if a consumer’s Android phone was valued at $850 for trade-in on day one, this is what it’s price decline would look like year-over-year.
Budget Android 4-year loss summary 2021:
- After 4 years, budget Android phones will lose -87.83% of their initial buyback value, on average.
- Over 48 months, the average yearly loss of an Android phone retailing at $399 or less is -39.80% of its original trade-in value.
- The lowest loss was -29.25%, and the largest was -57.20% in year two.
Budget Android Buyback Value Depreciation (Example)
Using the data’s averages, if a consumer’s budget Android device was valued at $350 for trade-in on day one, this is what it’s price decline would look like year-over-year.
Data source: The average yearly depreciation figures above depict the initial highest trade-in value, then map its decline over 4 years within the specific OS release price bands. We used the best trade-in value from multiple buyback stores from eligible devices marked as ‘good’ condition (for natural wear and tear estimates).
Cell Phone Brand Depreciation
Phone Manufacturer Price Drops 2021-2022
Next up, we expanded the 4-year dataset of depreciation seen above in the operating system analysis to include older handsets too.
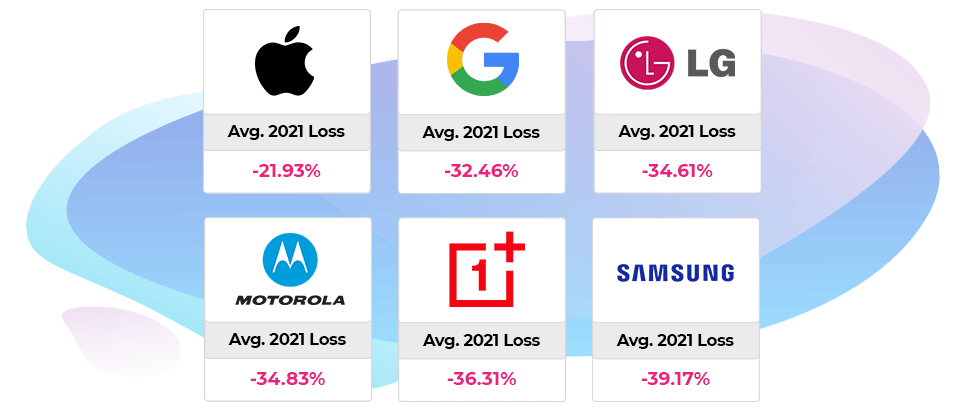
We took six leading smartphone manufacturers and calculated the average depreciation across their Range. Below, consumers can see which brands had excellent price retention in 2021-2022.
Apple iPhones held value even better than last year, mainly due to the latest devices declining slower than ever. Likewise, Google Pixel smartphones have replaced LG as the second-best handsets for price retention – although, as we mentioned in the first part of this report, Pixel phones start with a lower buyback value.
Average Smartphone Depreciation By Brand (2020-2021)
Ranked Least to Highest Depreciation:
- iPhone average trade-in loss was -21.93% in 2021-2022.
- Google Pixel’s average trade-in loss was -32.46% in 2021-2022.
- LG’s average trade-in loss was -34.61% in 2021-2022.
- Motorola’s average trade-in loss was -34.83% in 2021-2022.
- OnePlus average trade-in loss was -36.31% in 2021-2022.
- Samsung’s average trade-in loss was -39.17% in 2021-2022.
Data source: Average cell phone brand depreciation rates got measured from multiple buyback stores’ best available ‘good’ condition trade-in value. The data sample (01/01/2021 to 12/31/2021) comes from 300+ devices, including storage capacity-specific quotes.
Biggest Losers
Top Value & Percentage Loss 2021-2022
Below we see which smartphones released in 2019-2020 lost the most physical value in the trade-in market last year.
Of course, the majority of the smartphones that lost the most value are the ones with the highest retail values. However, there is a noticeable trend with the next-gen foldable devices dropping fast in the second-hand buyback market.
Leading the pack is the Galaxy Z Fold2 5G, which lost -$449.99 of its trade-in value in 2021, down from $999.99 in January (-45.00%).
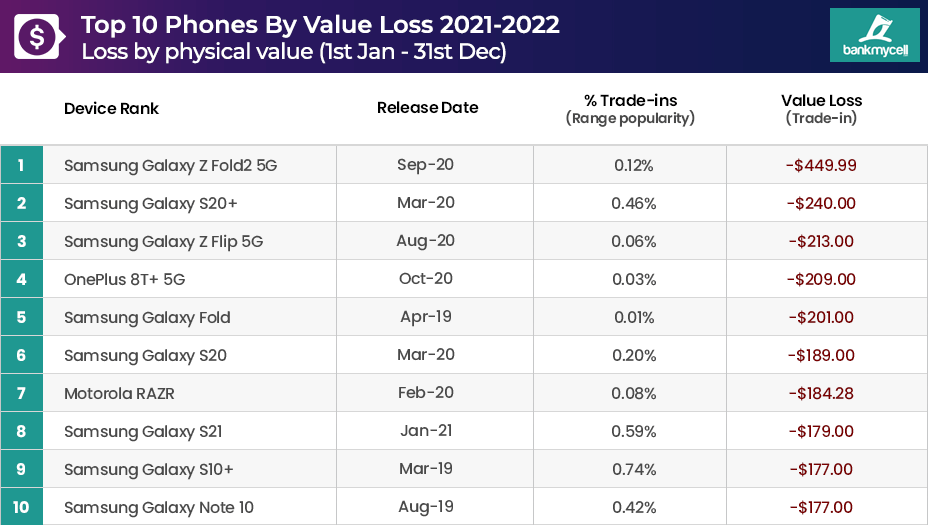
Data source: Smartphones released in 2019-2020, resale depreciation rates got measured from 01/01/2021 to 12/31/2021 from multiple buyback stores. Prices reflect ‘Good’ condition trade-in values (minor wear), and the value losses are an average across all storage sizes.
Below we see which smartphones released in 2019-2020 lost the highest percentage value in the trade-in market last year.
Eight of the handsets below launched with a retail price of $750 or less, except for the foldable RAZR and Galaxy Z. This further reflects the aggressive drop budget Android devices see in the first few years of release, as well as the foldable phone loss trend.
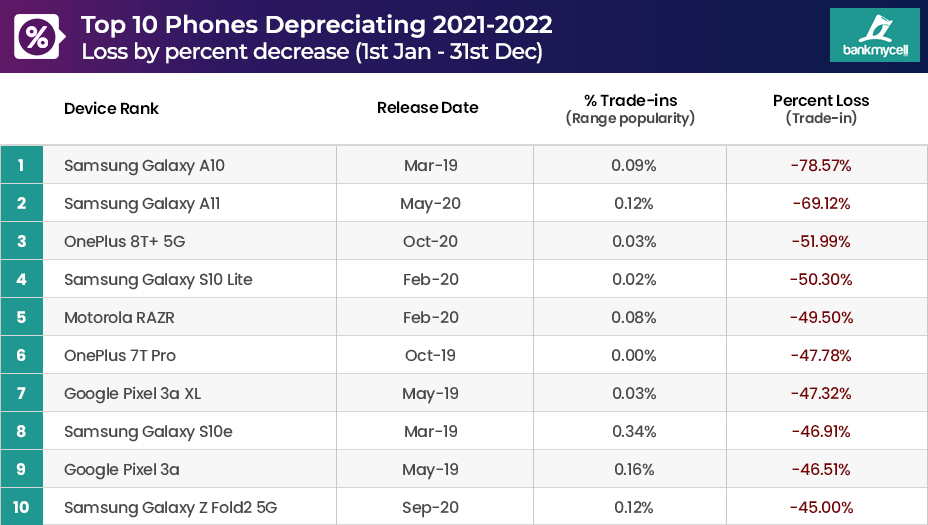
Data source: Smartphones released in 2019-2020, resale depreciation rates got measured from 01/01/2021 to 12/31/2021 from multiple buyback stores. Prices reflect ‘Good’ condition trade-in values (minor wear), and the percent losses are averages across all storage sizes.
iPhone Depreciation Report Highlights
iPhone Value Loss By Popularity (2021-2022)
Below, we’ve taken the most popular phones traded in through 2021-2022. Consumers can see the physical value and the percentage loss, or depreciation, of popular smartphones by brand.
Below, we’ve sorted the most popular iPhones by trade-in popularity, so consumers can see how much value these flagship Apple phones are losing in 12-months.
- Market Size: The top 10 most traded-in iPhones in 2021 made up -51.78% of all devices sold.
- Average Loss: These popular Apple smartphones only lost -15.23% or -$73.58 in 12 months.
- Top Value Loss: Out of the top 10 popular Apple devices, the highest value loss throughout 2021 was the iPhone 12 Pro at -$162.27.
- Top Percent Loss: The iPhone 7 lost the highest percentage loss at -28.33%, which is no surprise as Apple typically supports devices for 5-6 years, so demand in the resale market drops for buyers.
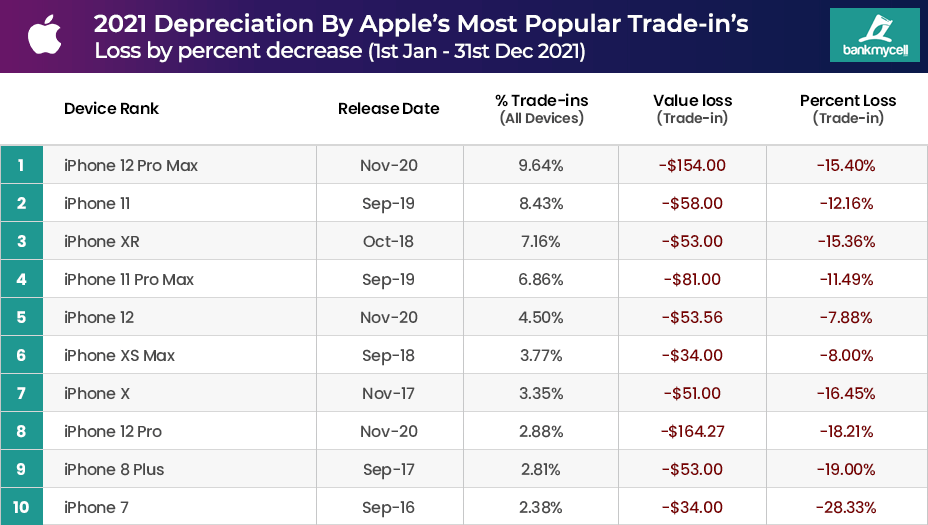
Data source: Top 10 most popular 2021 Apple trade-ins – Apple iPhone resale depreciation rates got measured from 01/01/2021 to 12/31/2021 from multiple buyback stores. Prices reflect ‘Good’ condition trade-in values (minor wear), and the value/percent losses are an average across all storage sizes.
Full Range: iPhone Value & Depreciation Highlights
Ignoring the top 10 trade-in popularity, below are any standout data points from the brand’s depreciation in 2021.
- Price Retention Leader: Apple is always #1 for price retention; this was the lowest year to date for iPhone trade-in value stability and overall price retention.
- 2021 iPhone 13 Range: In Q4 2021, following their release, the iPhone 13 range had solid retention, only losing an average of -3.51% from the initial trade-in price.
- 2020 iPhone 12 Range: Throughout 2021-2022, the iPhone 12 range had incredible price retention, losing an average of -13.02%.
- 2020’s iPhone SE: Last year, we reported that the budget iPhone SE was Apple’s black sheep when It comes to price retention, losing its value fast 8 months from release. By the end of 2021, it had lost 48.74% of its original release value, making it the fastest depreciating iPhone to date.
- 2019 iPhone 11 Range: Following the trend, the iPhone 11 range only lost an average of -10.72%.
- End of life: The now unsupported iPhone 5 range hits rock bottom with prices ranging from $8.33 to $10.50.
Samsung Depreciation (2020-2021)
Price Drops By Popular Trade-ins & Report Highlights
Below, we’ve sorted the most popular Samsung Galaxy phones by trade-in popularity, so consumers can see how much value these flagship Samsung phones are losing in 12-months.
- Market Size: The top 10 most traded-in Samsung phones in 2021 made up -7.75% of all devices sold.
- Average Loss: These popular Samsung smartphones lost an average of -23.25% or -$90.30 in 2021.
- Top Value Loss: Out of the top 10 popular Samsung devices, the highest value loss throughout 2021 was the Samsung Galaxy Note 10+ at -$130.00.
- Top Percent Loss: The Galaxy S10+ was the highest depreciating phone out of 2021’s most popular Samsung’s at -38.48%.
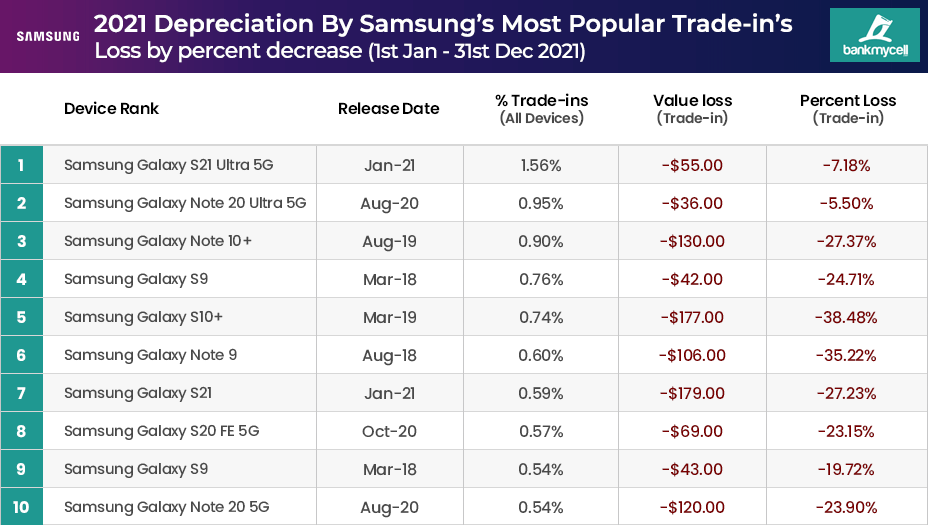
Data source: Top 10 most popular 2021 Samsung trade-ins – Samsung phone’s resale depreciation rates got measured from 01/01/2021 to 12/31/2021 from multiple buyback stores. Prices reflect ‘Good’ condition trade-in values (minor wear), and the value/percent losses are an average across all storage sizes.
Full Range: Samsung Value & Depreciation Highlights
Ignoring the top 10 trade-in popularity, below are any standout data points from the brand’s depreciation in 2021.
- Galaxy S21, S21+ Range: Releasing in January 2021, on average, the Samsung Galaxy S21 range lost -23.72% of its trade-in value over the year.
- Galaxy S21 Ultra: Out of the S21 devices released in 2021, the S21 Ultra held its price the best at a -16.35% loss from its initial trade-in value.
- Galaxy S20 Range: Released in March 2020, the S20 Range lost an average of -35.61% through 2021.
- Galaxy Z Flip Range: The 2021 Galaxy Z Flip3 5G lost -27.62% of its trade-in value 4 months from release. Whereas 2020’s Galaxy Z Flip 5G lost -34.76% through 2021.
- Galaxy Fold Range: Likewise, the Galaxy Z Fold3 -25.23% of its trade-in value 4 months from release. In contrast, 2020’s Galaxy Z Fold2 was the most aggressive loss out of Samsung’s 2020 releases at -45.00% through 2021.
- Galaxy Note Range: Even though it’s discontinued, the Note 10’s trade-in value lost -34.08%, which was better than the Galaxy Fold.
Google Pixel Depreciation (2020-2021)
Price Drops By Popular Trade-ins & Report Highlights
Below, we’ve sorted the most popular Google Pixel phones by trade-in popularity, so consumers can see how much value these Pixel phones are losing in 12-months.
- Market Size: The top 10 most traded-in Google Pixel phones in 2021 made up -2.44% of all devices sold.
- Average Loss: These popular Google smartphones lost an average of -27.60% or -$41.80 in 2021.
- Top Value Loss: Out of the top 10 popular Google Pixel devices, the highest value loss throughout 2021 was the Google Pixel 3 XL at -$68.00.
- Top Percent Loss: The Pixel 3a was the highest depreciating phone out of 2021’s most popular Google phones at -46.51%.
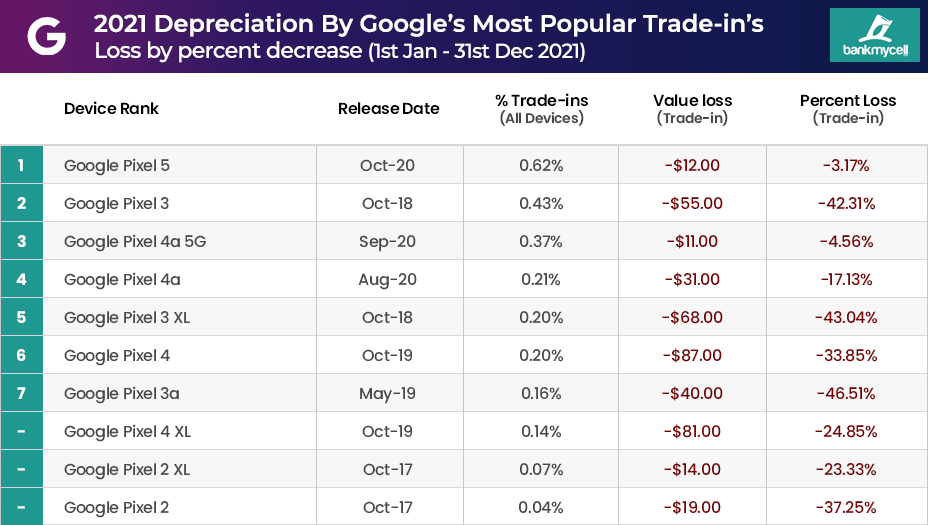
Data source: Top 10 most popular 2021 Google Pixel trade-ins – Google Pixel phones resale depreciation rates got measured from 01/01/2021 to 12/31/2021 from multiple buyback stores. Prices reflect ‘Good’ condition trade-in values (minor wear), and the value/percent losses are an average across all storage sizes.
Full Range: Google Pixel Value & Depreciation Highlights
Ignoring the top 10 trade-in popularity, below are any standout data points from the brand’s depreciation in 2021.
Google Pixel Flagships: The last 3 years of flagship pixel phones share a few common traits – a considerable drop from retail to their initial trade-in value, then low depreciation up until 24 months.
- Pixel 6 Range (2021): The starting trade-in value was -49.25% less than its retail value; however, it only lost -4.79% From Oct-Dec 2021.
- Pixel 5 Range (2020): Similar to the pattern on the Pixel 6, the trade-in value loss for the entire of 2021 was only –17% – However, 2 months after release, it was worth -46.63% less than its retail price.
- Pixel 4 Range (2019): 26 months following its release, the Pixel 4 was worth -69.39% less than its retail price and had an average trade-in value loss of -29.35% in 2021.
- Pixel 3a Range (2019): The 3a and 3a XL lost a massive -46.51% of its trade-in value in 2021, leaving it worth -77.53% less than consumers paid for it.
OnePlus Depreciation (2020-2021)
Price Drops By Popular Trade-ins & Report Highlights
Below, we’ve sorted the most popular OnePlus phones by trade-in popularity, so consumers can see how much value these top OnePlus phones are losing in 12-months.
- Market Size: The top 10 most traded-in OnePlus phones in 2021 made up -0.46% of all devices sold.
- Average Loss: These popular OnePlus smartphones lost an average of -35.32% or -$96.90 in 2021.
- Top Value Loss: Out of the top 10 popular OnePlus devices, the highest value loss throughout 2021 was the OnePlus 8 Pro at -$165.00.
- Top Percent Loss: The OnePlus 8T+ 5G was the highest depreciating phone out of 2021’s most popular OnePlus phones at -51.99%.
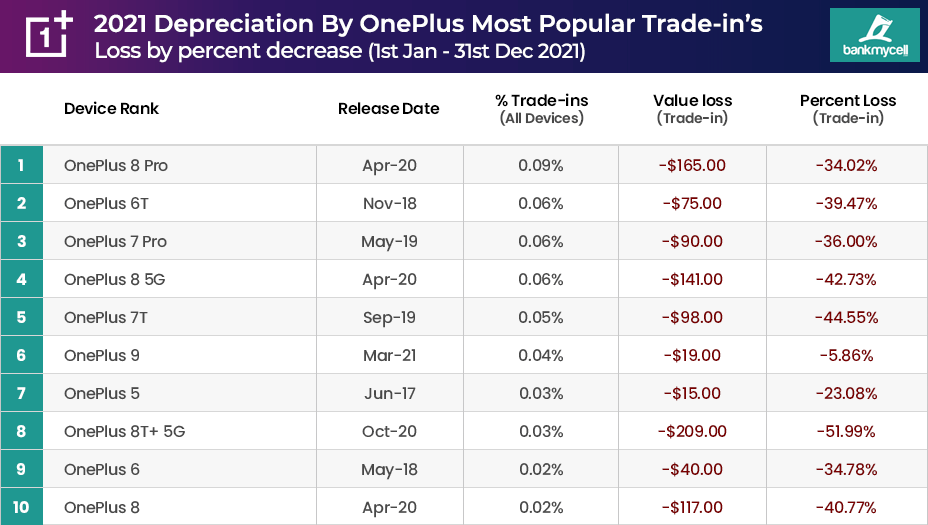
Data source: Top 10 most popular 2021 OnePlus trade-ins – OnePlus phone resale depreciation rates got measured from 01/01/2021 to 12/31/2021 from multiple buyback stores. Prices reflect ‘Good’ condition trade-in values (minor wear), and the value/percent losses are an average across all storage sizes.
Full Range: OnePlus Value & Depreciation Highlights
Ignoring the top 10 trade-in popularity, below are any standout data points from the brand’s depreciation in 2021.
- OnePlus 9/9 Pro (2021): The starting trade-in value was -55.56% less than its retail value; however, it only lost an average of -4.28% (Mar-Dec 2021).
- OnePlus 8/8T (2020): The OnePlus 8T range lost the most value in 2021, with an average of -46.01% compared with the OnePlus 8 range losing -37.39%.
- OnePlus 7T/7Pro (2019): Similarly, the 7T range lost an almost identical average of -46.16% in 2021, compared with the OnePlus 7 range losing -36.00%.
LG Depreciation (2020-2021)
Price Drops By Popular Trade-ins & Report Highlights
Below, we’ve sorted the most popular LG phones by trade-in popularity, so consumers can see how much value these top LG phones are losing in 12-months.
- Market Size: The top 10 most traded-in LG phones in 2021 made up -1.16% of all devices sold.
- Average Loss: These popular LG smartphones lost an average of -37.68% or -$36.00 in 2021.
- Top Value Loss: Out of the top 10 popular LG devices, the highest value loss throughout 2021 was the LG V60 ThinQ at -$99.00.
- Top Percent Loss: Ignoring the Nexus 5X, which was released in 2015 and had a low start price anyway – The LG V40 ThinQ was the highest depreciating LG phone at -53.04%
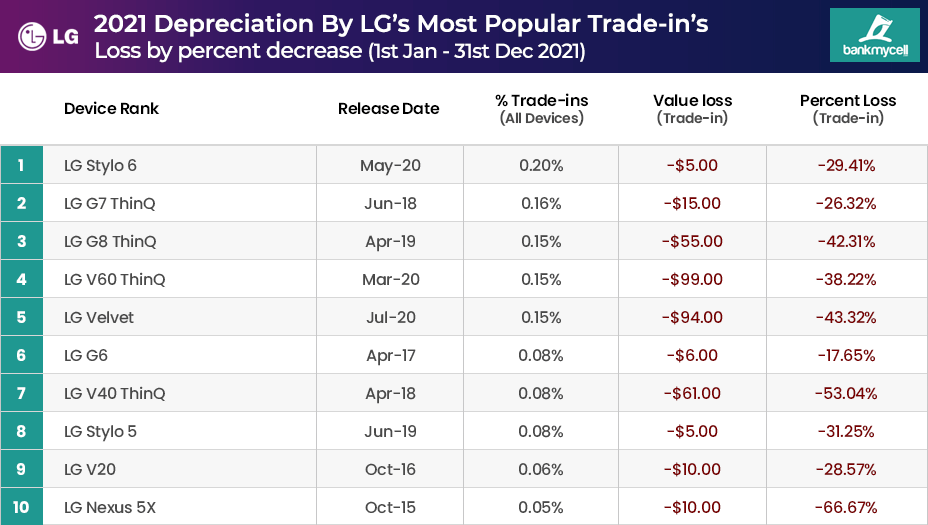
Data source: Top 10 most popular 2021 LG trade-ins – LG phones resale depreciation rates got measured from 01/01/2021 to 12/31/2021 from multiple buyback stores. Prices reflect ‘Good’ condition trade-in values (minor wear), and the value/percent losses are an average across all storage sizes.
Full Range: LG Value & Depreciation Highlights
Ignoring the top 10 trade-in popularity, below are any standout data points from the brand’s depreciation.
- LG Devices (2020): The flagship LG phones released in 2020 are worth on average -85.31% less than they were at release.
- LG Devices (2019): The flagship LG phones released in 2019 are worth on average -87.36% less than they were at release.
- LG V60 (2020): In less than 2 years (21 months), the LG V60 is worth -82.20% less than its original retail price.
- LG Wing (2020): In 14 months, the LG Wing 5G is worth -80.68% less than its original retail price.
Motorloa Depreciation (2020-2021)
Price Drops By Popular Trade-ins & Report Highlights
Below, we’ve sorted the most popular Motorola phones by trade-in popularity, so consumers can see how much value these top Motorola phones are losing in 12-months.
- Market Size: The top 10 most traded-in Motorola phones in 2021 made up -1.10% of all devices sold.
- Average Loss: These popular Motorola smartphones lost an average of -24.45% or -$24.23 in 2021.
- Top Value Loss: Out of the top 10 popular Motorola devices, the highest value loss throughout 2021 was the Motorola RAZR at -$184.28.
- Top Percent Loss: Ignoring the Droid Maxx that lost all value due to its 2013 release -The RAZR was also the highest depreciating phone out of 2021’s most popular Motorola phones at -49.50%.
*Important: Low 2021 depreciation rates don’t necessarily mean devices have held value – as per our 4-year android loss chart, many Android devices lose value heavily in the first 1-2 years.
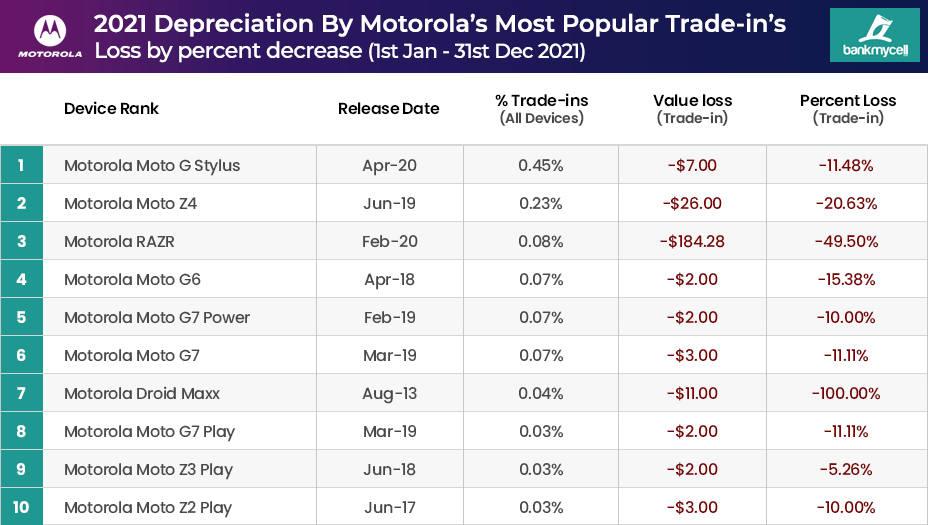
Data source: Top 10 most popular 2021 Motorola trade-ins – Motorola phones resale depreciation rates got measured from 01/01/2021 to 12/31/2021 from multiple buyback stores. Prices reflect ‘Good’ condition trade-in values (minor wear), and the value/percent losses are an average across all storage sizes.
Full Range: Motorola Value & Depreciation Highlights
Ignoring the top 10 trade-in popularity, below are any standout data points from the brand’s depreciation.
- Motorola Flagship Devices (2020): The flagship Motorola phones released in 2020 are worth on average -81.53% less than they were at release.
- Motorola Budget Devices (2019): The budget Motorola phones released in 2019 are worth on average -85.93% less than they were at release.
- Motorola RAZR (2020): Both the 4G and 5G RAZR devices, which retailed for $1399-$1499, were worth less than $200 by Dec 2021 (-79.76% loss from retail on average).
- Motorola Edge+ (2020): Launched for $999 in May 2020 and was worth less than $150 by Dec 2021.
DATA METHODOLOGY 2021-2022
BankMyCell receives pricing from multiple trade-in stores; the specific data methodology used in this report is:
- Unless specifically mentioned, all price and depreciation figures got tracked from the initial trade-in value (A to B date), NOT the device’s launch price.
- The highest device pricing is recorded each day from hourly price feed updates through multiple online buyback stores.
- The highest ‘good’ condition trade-in value is used for all charts as it’s the most common trade-in condition.
- All storage capacity pricing is recorded per device. Where applicable, average prices were created for the parent device.
- Depreciation is measured from the initial price recorded on 01/01/2021, or the first available for 2021 releases, and the final on 12/31/2021.
- Value loss is measured from the initial price recorded on 01/01/2021, or the first available for 2021 releases, and the final on 12/31/2021.
- Depreciation by operating system uses average data from all devices under the corresponding release price brackets.
- iOS Phones released at a price of over $699.
- Android phones released at a price of over $699.
- Budget Android phones released with a price under $399.


