Mobile Gaming Industry Revenue Statistics
How Much is the Mobile Gaming Industry Worth? 2025


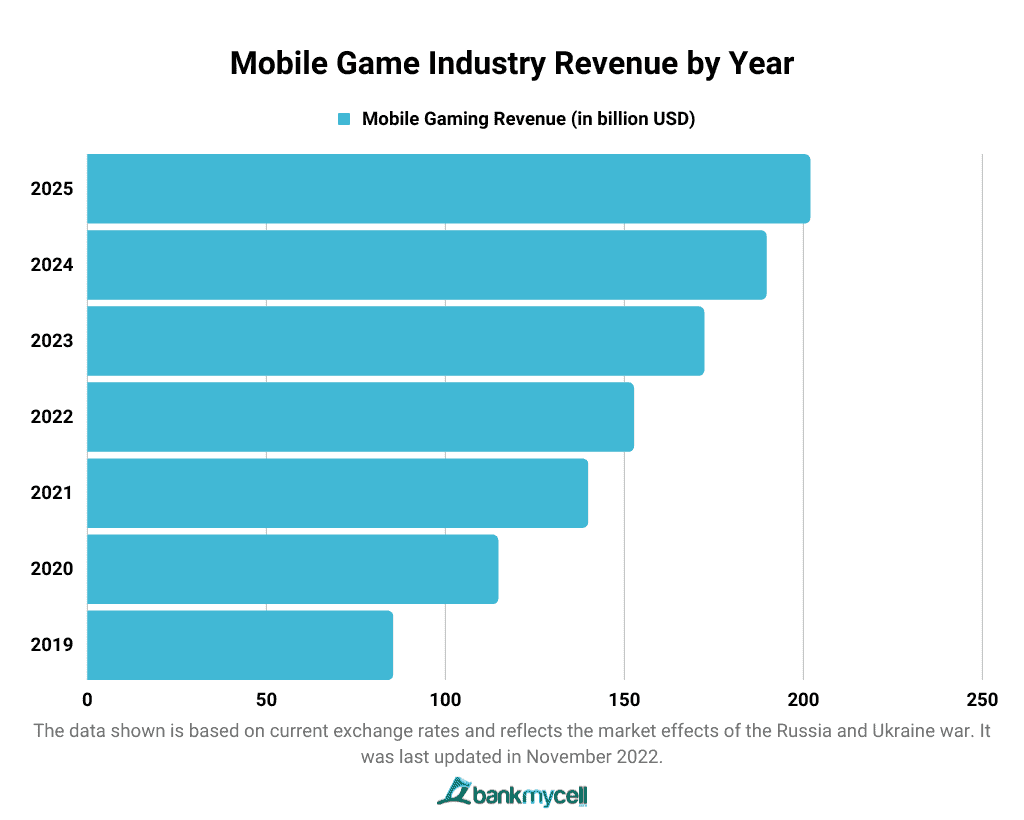
The global mobile gaming market is forecast to be valued at US $172.10 billion in 2023, an increase of $19.6 billion or 12.85% from the previous year. The mobile gaming industry growth is expected to reach 10.11% in 2024, or $189.50 billion in revenue.
This article features everything you need to know about the rapid growth and trends of the mobile gaming industry, including the revenue and number of mobile gamers by country, mobile games market share, and many more.
Editors Picks:
- Mobile Gaming Market Size: The mobile gaming market is estimated to be valued at US $172.10 billion this 2023, achieving a 12.9% year-on-year growth. It is projected to grow by 17.20% from 2023 to 2025, an increase of $29.6 billion in revenue.
- Mobile Gaming Revenue Share: Out of the total digital gaming industry revenue worldwide, mobile gaming was responsible for 77.7% of revenue. This shows the growing popularity of mobile devices as a gaming platform.
- Mobile Game Users: There will be 1.925 billion mobile gamers in the world this 2023. At a 25.1% penetration rate in the same period, around one in four people worldwide will be playing mobile games. It is expected to grow to 2.3 billion gamers by 2027, which will mean a 20.66% user growth in four years.
- ARPU for Mobile Games: The Mobile Games segment’s average revenue per user is expected to be $89.38 in 2023. It is forecasted that it will increase by 6.7% in 2027 for an ARPU of $95.41.
- Top Country by Mobile Gaming Revenue: The Chinese market is anticipated to generate the most revenue at $81.90 billion in 2023.
- Top Mobile Gaming Companies: Tencent, the company behind PUBG Mobile and Honor of Kings, leads the mobile gaming revenue with $27.88 billion. It is followed by Netease, Garena, Activision Blizzard, and Cygames.
In this Article:
- How Much is the Mobile Gaming Industry Worth? (2021-2024)
- Mobile Gaming Market Size Growth 2021-2030 (CAGR)
- Worldwide Mobile Gaming Revenue Share
- Mobile Gaming User Revenue Statistics
- Top 10 Companies by Game Revenue Market Share
- Mobile Gaming Revenue by Country
- Mobile Gaming Penetration by Country
- Mobile Video Games Market Revenue Share by Year
How Much is the Mobile Gaming Industry Worth?
Mobile Game Industry Revenue by Year (2021-2027)
| Gender | Annual Revenue (in USD) |
|---|---|
| 2025 | $201.70 |
| 2024 | $189.50 |
| 2023 | $172.10 |
| 2022 | $152.50 |
| 2021 | $139.70 |
| 2020 | $114.60 |
| 2019 | $85.25 |
Note: The data shown is based on current exchange rates and reflects the market effects of the Russia and Ukraine war. It was last updated in November 2022.
- Data Table
-
Mobile Game Industry Revenue by Year (2021-2027)
Gender Annual Revenue (in USD) 2025 $201.70 2024 $189.50 2023 $172.10 2022 $152.50 2021 $139.70 2020 $114.60 2019 $85.25 Note: The data shown is based on current exchange rates and reflects the market effects of the Russia and Ukraine war. It was last updated in November 2022.
- Data Graphic
-

The mobile gaming industry is estimated to grow by 35.65% from 2021 to 2024. The $152.50 billion estimated mobile gaming market value for 2022 is an increase of $12.8 billion, or 9.16%, from 2021. It is estimated to generate $189.50 billion by 2024.
In July 2022, the global mobile gaming market generated an estimated $6.7 billion from gamers’ in-app purchases in Google Play Store and App Store, a 10.2% year-on-year decrease.
Mobile gamers usually spend their money purchasing in Mid-Core mobile games, which account for 60% of revenue in 2022. Mid-core games require more skill and strategy to master than casual games because they are more challenging and engaging. It also frequently includes side quests, multiplayer experiences, and resource management.
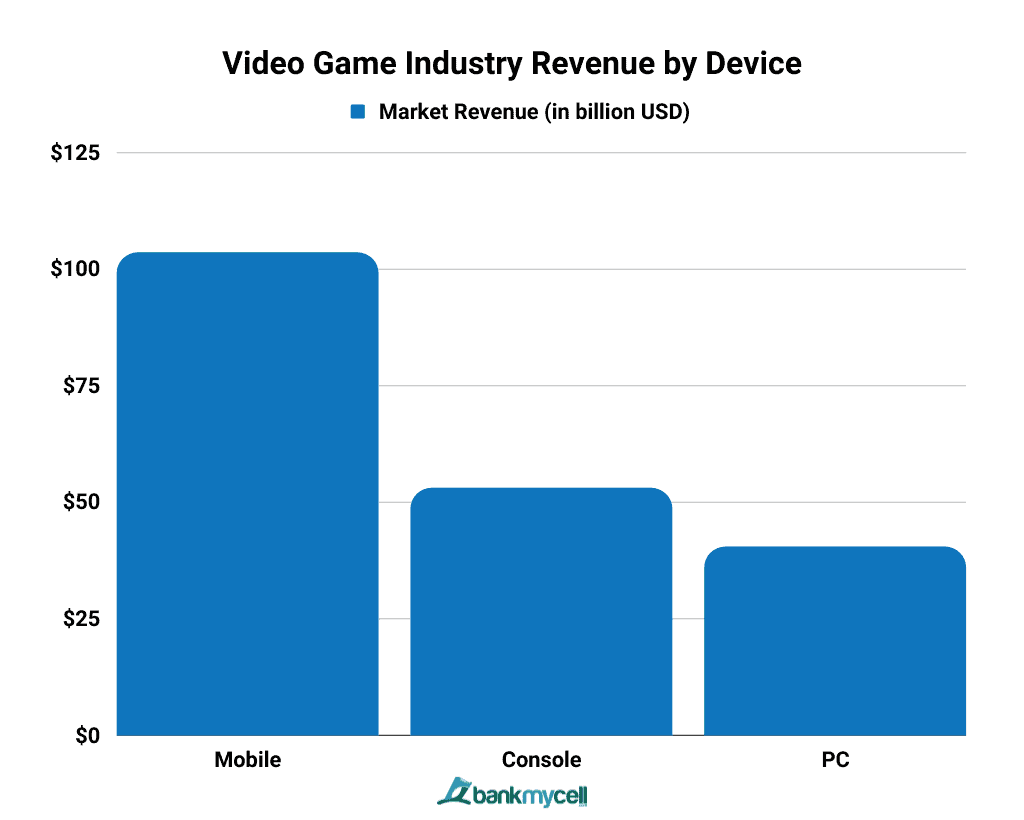
Video Game Industry Revenue by Device
| Device | Market Revenue (in billion USD) |
|---|---|
| Mobile | $103.50 |
| Console | $53.00 |
| PC | $40.40 |
- Data Table
-
Device Market Revenue (in billion USD) Mobile $103.50 Console $53.00 PC $40.40 - Data Graphic
-

The mobile device has the highest gaming revenue, with $103.50 billion in the world this 2022. Console follows with $53 billion, while PC comes in last with $40.40 billion. Smartphones generate the vast majority of mobile gaming revenue, with tablet devices accounting for only a tiny portion of total mobile gaming revenue.
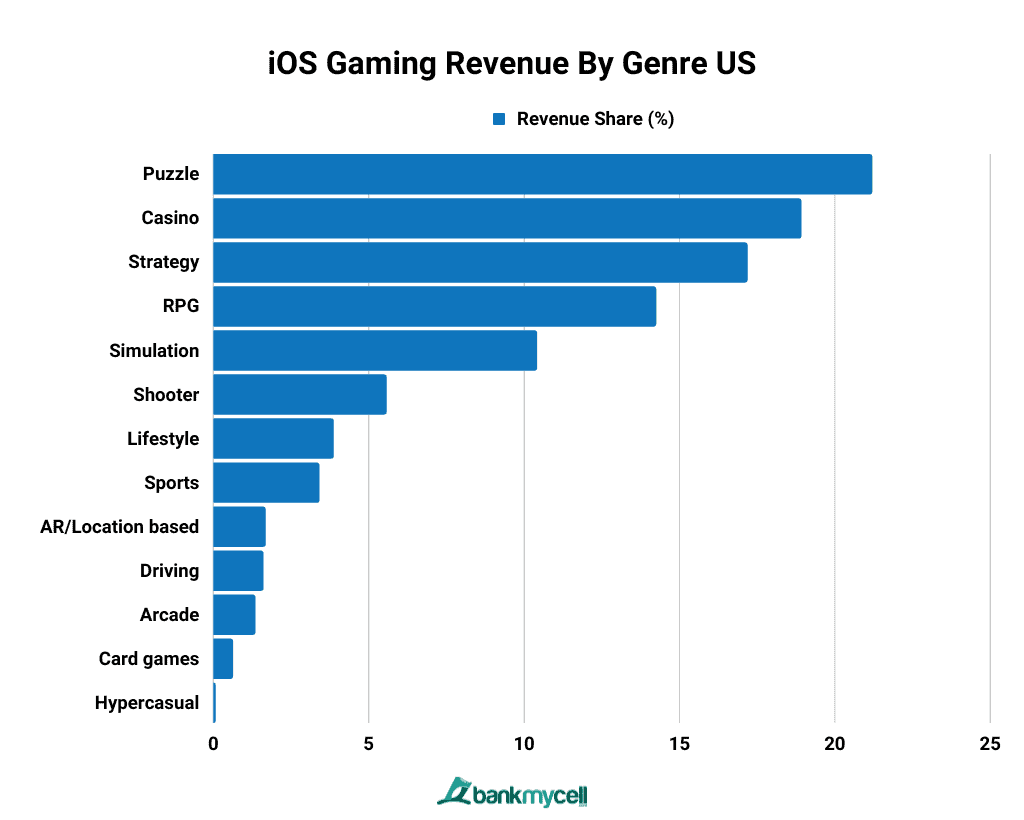
Mobile puzzle games top the market by genre, generating 21.18% of mobile gaming revenue, specifically in iOS devices, in North America in the second quarter of 2021.
iOS Gaming Revenue By Genre US (2021)
| Genre | Revenue Share (%) |
|---|---|
| Puzzle | 21.18% |
| Casino | 18.90% |
| Strategy | 17.17% |
| RPG | 14.23% |
| Simulation | 10.40% |
| Shooter | 5.56% |
| Lifestyle | 3.86% |
| Sports | 3.40% |
| AR/Location based | 1.67% |
| Driving | 1.60% |
| Arcade | 1.34% |
| Card games | 0.62% |
| Hypercasual | 0.06% |
- Data Table
-
Genre Revenue Share (%) Puzzle 21.18% Casino 18.90% Strategy 17.17% RPG 14.23% Simulation 10.40% Shooter 5.56% Lifestyle 3.86% Sports 3.40% AR/Location based 1.67% Driving 1.60% Arcade 1.34% Card games 0.62% Hypercasual 0.06% - Data Graphic
-

Top Mobile Game Genres by Revenue Share
Puzzle games lead the mobile gaming genres in popularity with 21.18% revenue share, followed by Casino with 18.9% and Strategy games with 17.17 in the US this Q2 2021.
- Puzzle – 21.18%
- Casino – 18.9%
- Strategy – 17.17%
- RPG – 14.23%
- Simulation – 10.4%
- Shooter – 5.56%
- Lifestyle – 3.86%
- Sports – 3.4%
- AR/Location based – 1.67%
- Driving – 1.60%
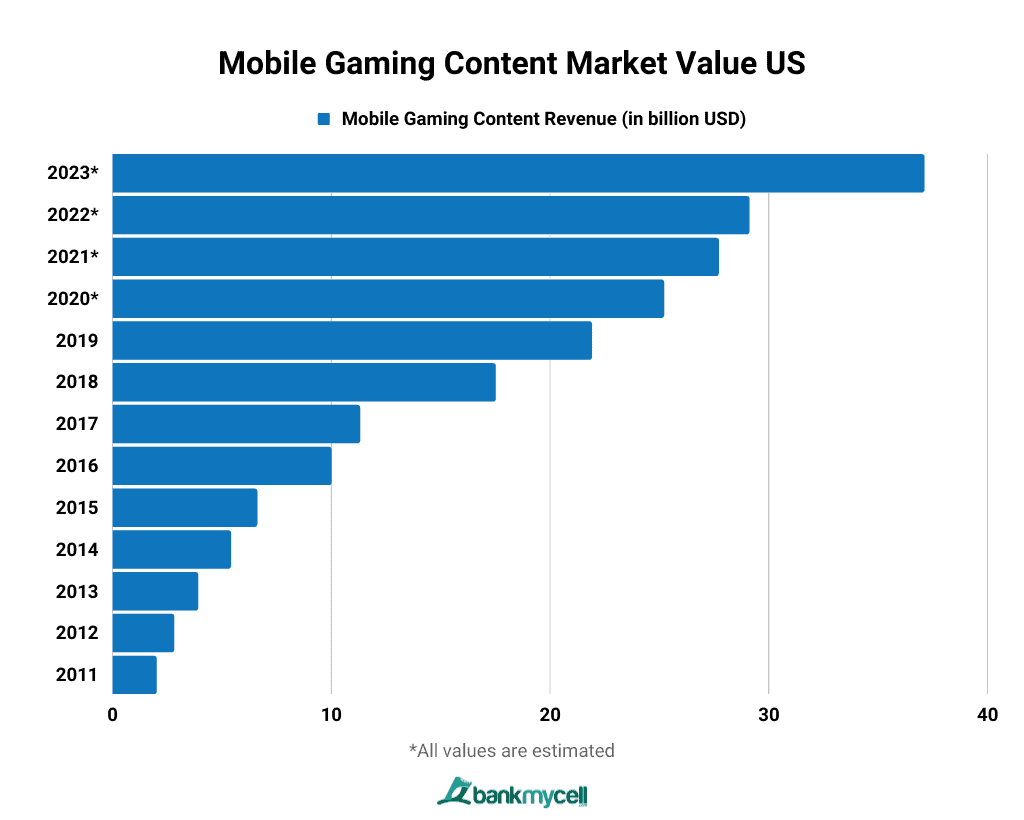
Mobile Gaming Content Market Value US (2011-2023)
| Year | Mobile Gaming Content Revenue (in billion USD) |
|---|---|
| 2023* | $37.10 |
| 2022* | $29.10 |
| 2021* | $27.70 |
| 2020* | $25.20 |
| 2019 | $21.90 |
| 2018 | $17.50 |
| 2017 | $11.30 |
| 2016 | $10.00 |
| 2015 | $6.60 |
| 2014 | $5.40 |
| 2013 | $3.90 |
| 2012 | $2.80 |
| 2011 | $2.00 |
- Data Table
-
Year Mobile Gaming Content Revenue (in billion USD) 2023* $37.10 2022* $29.10 2021* $27.70 2020* $25.20 2019 $21.90 2018 $17.50 2017 $11.30 2016 $10.00 2015 $6.60 2014 $5.40 2013 $3.90 2012 $2.80 2011 $2.00 - Data Graphic
-

Note: *All values are estimated.
The mobile gaming content market in the US is estimated to be worth $37.10 billion this 2023. It is anticipated to grow by 27.56% in the next year. The mobile segment has a huge share of the overall gaming software market.
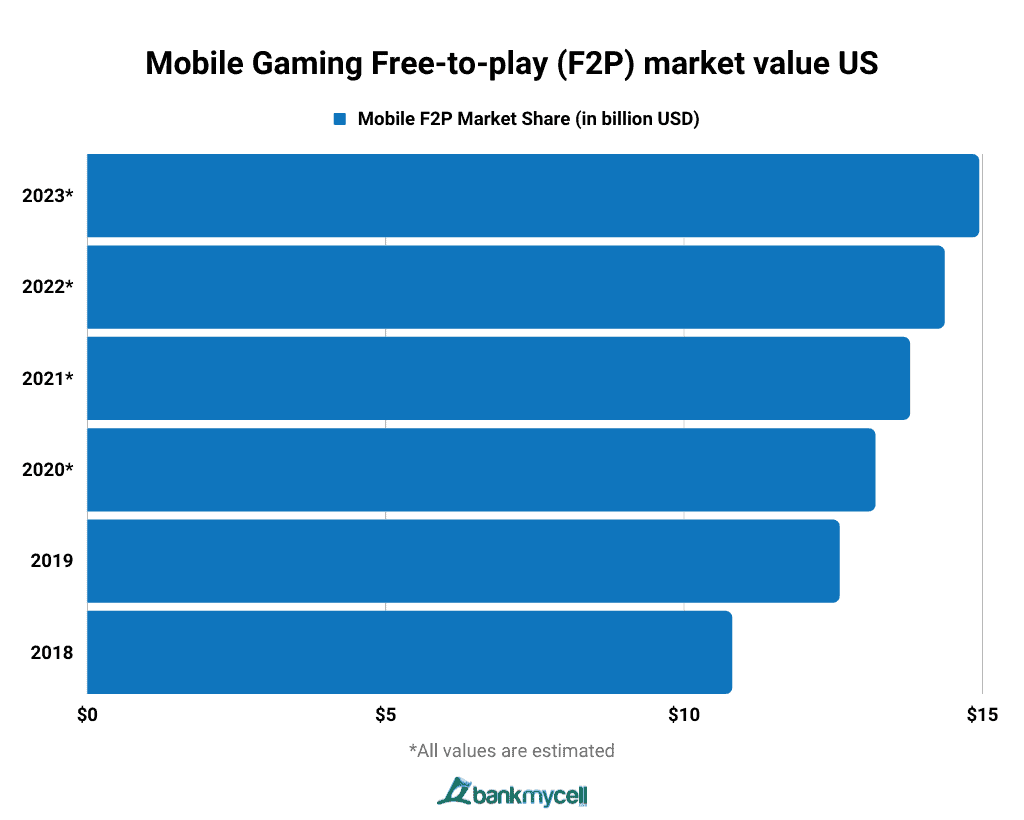
Mobile Gaming Free-to-play (F2P) market value US (2018-2023)
| Year | Mobile F2P Market Share (in billion USD) |
|---|---|
| 2023* | $14.94 |
| 2022* | $14.36 |
| 2021* | $13.78 |
| 2020* | $13.20 |
| 2019 | $12.60 |
| 2018 | $10.80 |
- Data Table
-
Year Mobile F2P Market Share (in billion USD) 2023* $14.94 2022* $14.36 2021* $13.78 2020* $13.20 2019 $12.60 2018 $10.80 - Data Graphic
-

Free-to-play (F2P) mobile gaming is expected to account for $14.36 billion in market share in 2022, rising to $14.94 billion by 2023 in the United States. The mobile segment is also expected to have the largest share in most of the F2P market.
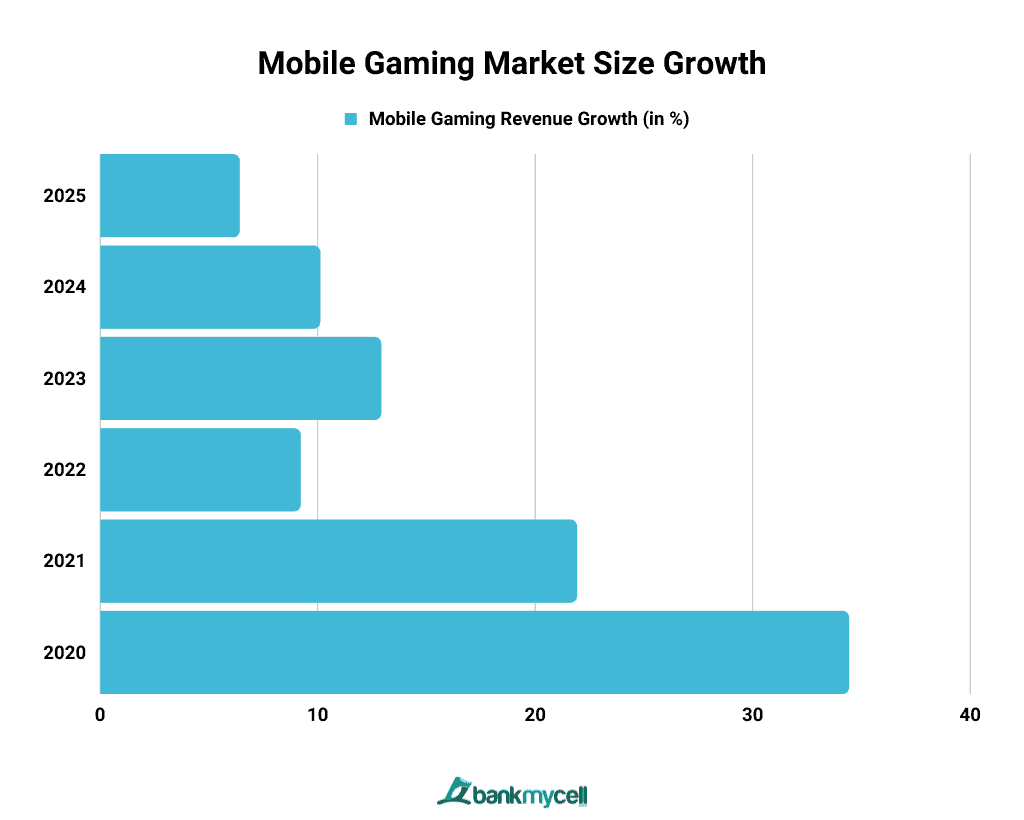
Mobile Gaming Market Size Growth 2021-2025 (CAGR)
| Year | Mobile Gaming Revenue Growth (in %) |
|---|---|
| 2025 | 6.4 |
| 2024 | 10.1 |
| 2023 | 12.9 |
| 2022 | 9.2 |
| 2021 | 21.9 |
| 2020 | 34.4 |
- Data Table
-
Year Mobile Gaming Revenue Growth (in %) 2025 6.4 2024 10.1 2023 12.9 2022 9.2 2021 21.9 2020 34.4 - Data Graphic
-

Note: *All values are estimated.
This 2023, the mobile gaming market growth is expected to achieve a 12.9% year-on-year increase. Mobile gaming growth saw its biggest leap during the pandemic when it reached a 34.4% increase in revenue in 2020.
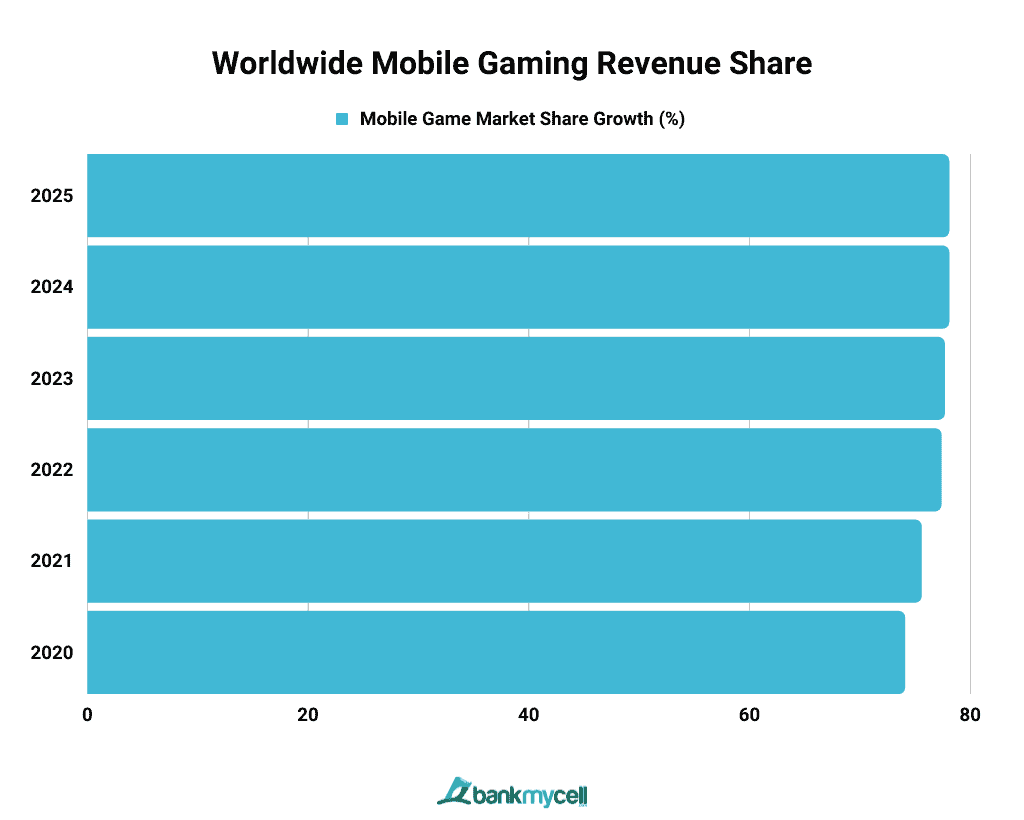
Worldwide Mobile Gaming Revenue Share
| Year | Mobile Game Market Share (%) |
|---|---|
| 2025 | 78.1 |
| 2024 | 78.1 |
| 2023 | 77.7 |
| 2022 | 77.4 |
| 2021 | 75.6 |
| 2020 | 74.1 |
- Data Table
-
Year Mobile Game Market Share (%) 2025 78.1 2024 78.1 2023 77.7 2022 77.4 2021 75.6 2020 74.1 - Data Graphic
-

Note: *All values are estimated.
This year, mobile gaming is responsible for around 77.7% of the total digital gaming revenue in the world. From 2020 up to the present, mobile games have provided around 75% or more of the revenue share in gaming worldwide.
Mobile Gaming User Revenue Statistics
In this section, you will discover the mobile gaming industry’s growth in user revenue, including the number of people who play games on mobile devices, the user penetration rate, and average revenue per user (ARPU).
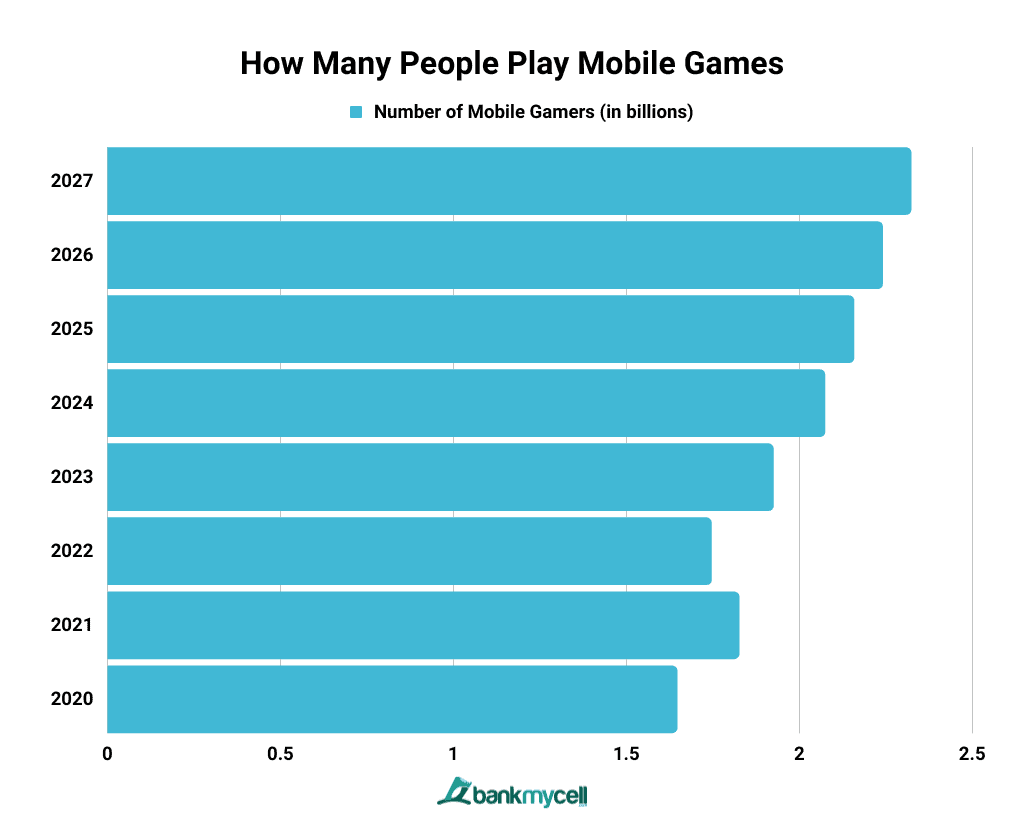
How Many People Play Mobile Games in 2023?
| Year | Number of Mobile Gamers (in billions) |
|---|---|
| 2027 | 2.323 |
| 2026 | 2.241 |
| 2025 | 2.158 |
| 2024 | 2.074 |
| 2023 | 1.925 |
| 2022 | 1.746 |
| 2021 | 1.826 |
| 2020 | 1.647 |
- Data Table
-
Year Number of Mobile Gamers (in billions) 2027 2.323 2026 2.241 2025 2.158 2024 2.074 2023 1.925 2022 1.746 2021 1.826 2020 1.647 - Data Graphic
-

Around 1.925 billion play mobile games worldwide this 2023, an increase of 10.24% or 179 million more users from the previous year. It is expected to grow, accounting for 2.3 billion mobile gamers by 2027, which will mean a 20.66% growth in four years despite China’s ongoing ban on several mobile games from the West.
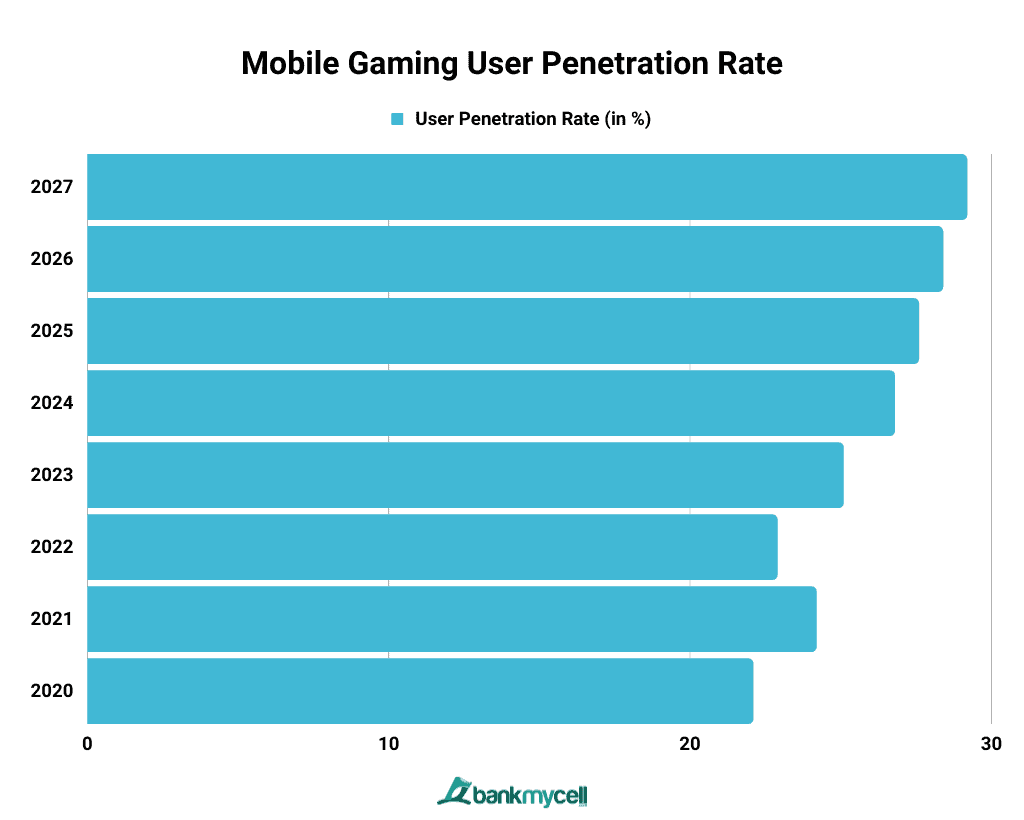
Mobile Gaming User Penetration Rate
| Year | User Penetration Rate (in %) |
|---|---|
| 2027 | 29.2 |
| 2026 | 28.4 |
| 2025 | 27.6 |
| 2024 | 26.8 |
| 2023 | 25.1 |
| 2022 | 22.9 |
| 2021 | 24.2 |
| 2020 | 22.1 |
- Data Table
-
Year User Penetration Rate (in %) 2027 29.2 2026 28.4 2025 27.6 2024 26.8 2023 25.1 2022 22.9 2021 24.2 2020 22.1 - Data Graphic
-

The mobile gaming user penetration is expected to be 25.1% in 2023. This means that around one in four people worldwide play mobile games. The percentage of mobile gamers is expected to grow to around 30% of the world’s population in 2027.
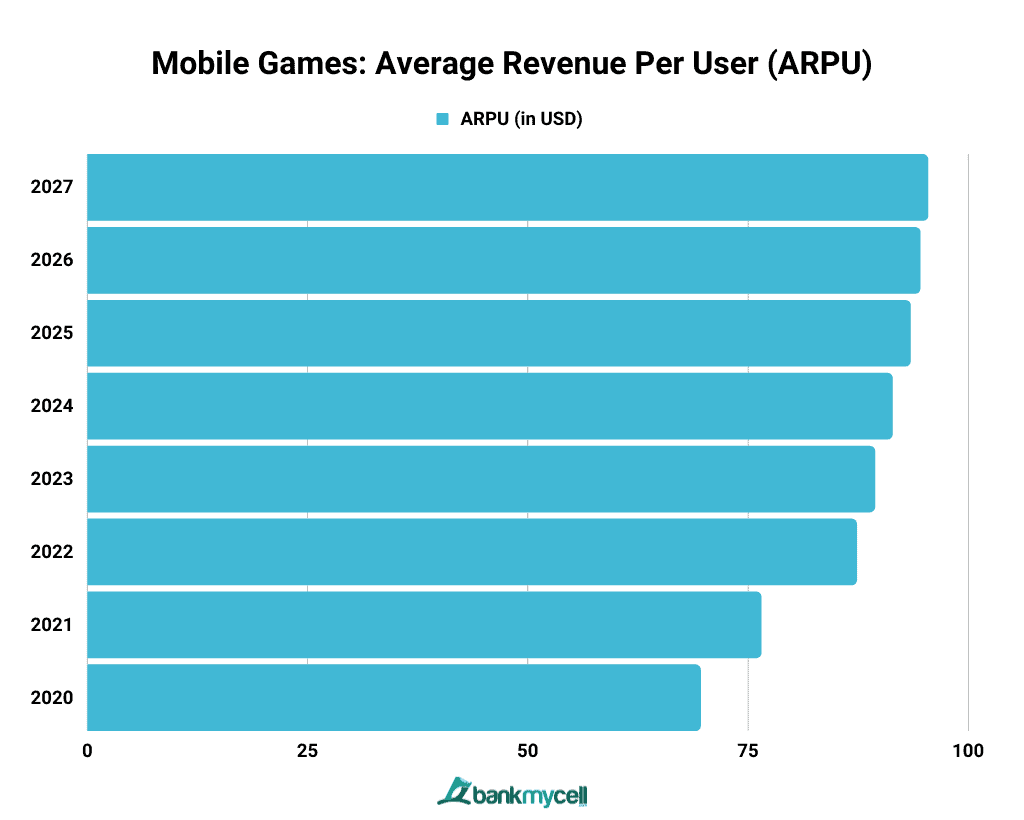
Mobile Games: Average Revenue Per User (ARPU)
| Year | ARPU (in USD) |
|---|---|
| 2027 | 95.41 |
| 2026 | 94.53 |
| 2025 | 93.42 |
| 2024 | 91.37 |
| 2023 | 89.38 |
| 2022 | 87.32 |
| 2021 | 76.48 |
| 2020 | 69.59 |
- Data Table
-
Year ARPU (in USD) 2027 95.41 2026 94.53 2025 93.42 2024 91.37 2023 89.38 2022 87.32 2021 76.48 2020 69.59 - Data Graphic
-

The Mobile Games segment’s average revenue per user (ARPU) is expected to be $89.38 in 2023, up by $2.06 from 2022. It is forecasted that it will reach $95.41 by 2027. The Chinese market is anticipated to generate the most revenue at $81.90 billion in 2023
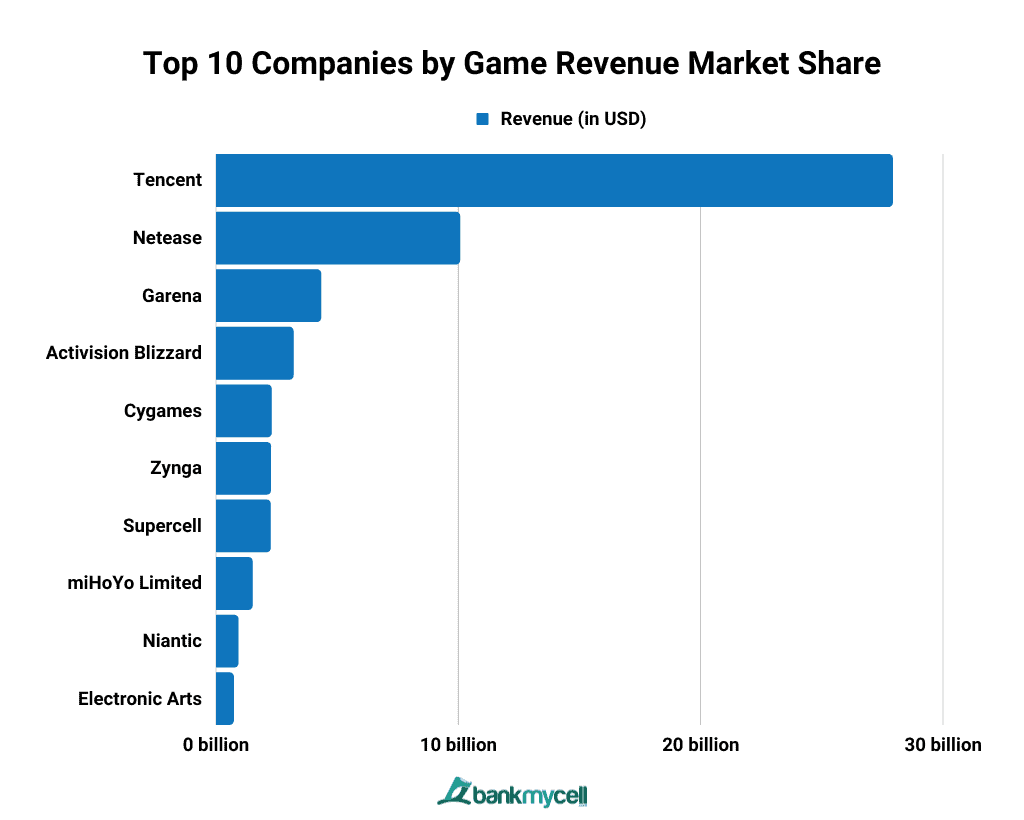
Top 10 Companies by Game Revenue Market Share
Tencent, the company behind PUBG Mobile and Honor of Kings, leads the mobile game revenue statistics with $27.88 billion. See below the top ten companies ranked by mobile gaming revenue in 2021, along with the year they were founded.
| Mobile Game Publishers | Revenue (USD) |
|---|---|
| Tencent (1998) | $27.888 billion |
| Netease (1997) | $10.048 billion |
| Garena (2009) | $4.320 billion |
| Activision Blizzard (2008) | $3.182 billion |
| Cygames (2011) | $2.282 billion |
| Zynga (2007) | $2.250 billion |
| Supercell (2010) | $2.240 billion |
| miHoYo Limited (2011) | $1.495 billion |
| Niantic (2011) | $909 million |
| Electronic Arts (1982) | $718 million |
- Data Table
-
Mobile Game Publishers Revenue (USD) Tencent (1998) $27.888 billion Netease (1997) $10.048 billion Garena (2009) $4.320 billion Activision Blizzard (2008) $3.182 billion Cygames (2011) $2.282 billion Zynga (2007) $2.250 billion Supercell (2010) $2.240 billion miHoYo Limited (2011) $1.495 billion Niantic (2011) $909 million Electronic Arts (1982) $718 million - Data Graphic
-

What is the biggest video game company today?
Tencent is the largest mobile game company in the world, with revenue generating nearly $28 billion in 2021. Founded in China way back in 1998, they are the developers of popular mobile games such as PUBG Mobile, Honor of Kings, and Moonlight Blade (Tianya Mingyue Knife).
With approximately $2.01 billion in revenue from gaming apps across the Google Play and Apple App Store worldwide, PUBG Mobile will be the most popular mobile game of Tencent in 2021. It also achieved the most downloaded mobile gaming title of the year.
In addition, Tencent’s market growth globally is because of its investments in over 40 gaming companies that developed popular gaming apps such as Fortnite, League of Legends, and Clash of Clans.
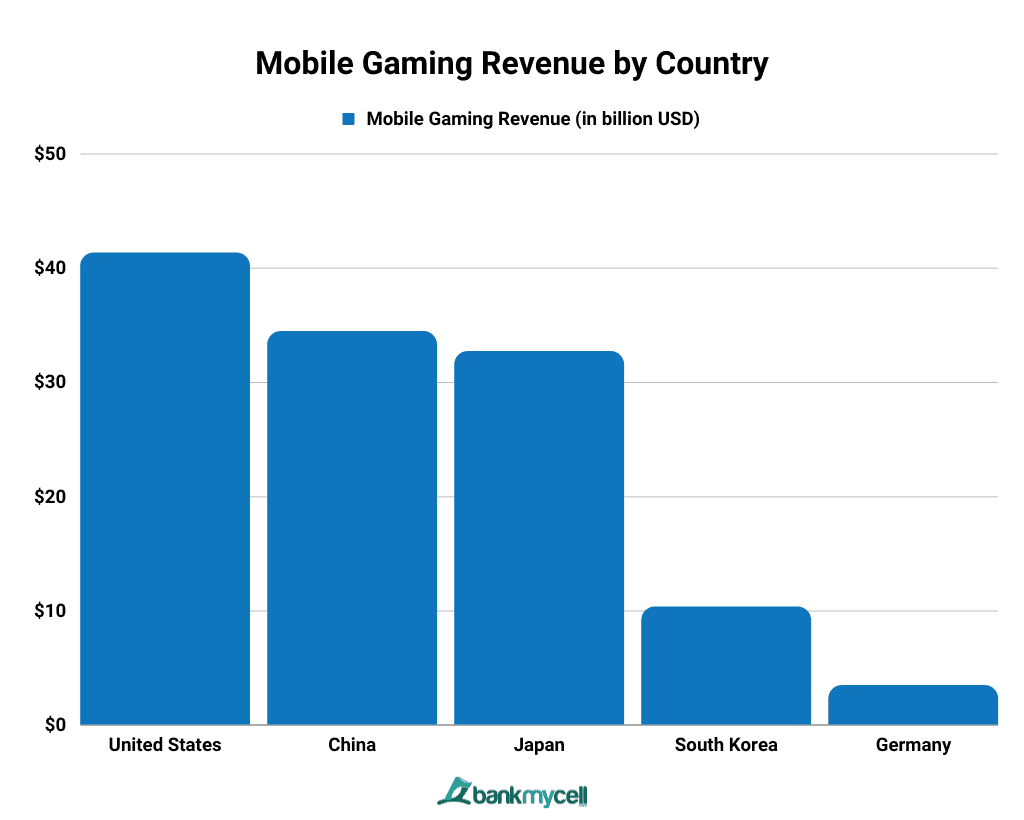
Mobile Gaming Revenue by Country
| Country | Mobile Gaming Revenue (in billion USD) |
|---|---|
| United States | $41.33 |
| China | $34.45 |
| Japan | $32.71 |
| South Korea | $10.31 |
| Germany | $3.43 |
- Data Table
-
Country Mobile Gaming Revenue (in billion USD) United States $41.33 China $34.45 Japan $32.71 South Korea $10.31 Germany $3.43 - Data Graphic
-

The top five mobile gaming markets in the world are the US, China, Japan, South Korea, and Germany. In 2022, the United States generated $41.33 billion in mobile gaming revenue, topping the global charts. China came in second with $34.45 billion, while Japan followed with $32.71 billion, falling 5% behind. South Korea took the fourth spot with $10.31 billion, and Germany came in the top 5 with $3.43 billion.
How Much is the Mobile Game Market Worth in the US
The United States generated $41.33 billion in revenue in 2022, dominating the mobile gaming market. It is set to reach a 7.31% compound annual growth rate (CAGR) by 2022 to 2027, projecting a market volume of $58.81 billion by 2027.
The user penetration is expected to be 44.9% in 2022 and 52.9% by 2027. It stems from the fact that the pandemic has dramatically affected the mobile gaming industry worldwide, particularly in the US. Game developers build more games, and smartphones are developed to provide a more robust user experience, attracting more gamers. As a result, the total market size will amount to $41.71 billion in 2022.
How Much is the Mobile Game Market Worth in China
China generated $34.45 billion in revenue in 2022, falling 16.64% behind the United States in the mobile games market. The number of gamers is anticipated to grow to 737.5 million, with a user penetration of 50.2% by 2027.
How Much is the Mobile Game Market Worth in Japan
Japan generated $32.71 billion in revenue in 2022, trailing China by 5% in the mobile games market. By 2027, the number of gamers is expected to reach 38.2 million, with a user penetration of 31.1%.
How Much is the Mobile Game Market Worth in South Korea
In 2022, South Korea generated $10.31 billion in revenue, trailing Japan by 68.48% in the mobile games market. By 2027, the number of gamers is expected to increase to 25.7 million, with a user penetration of 50.2%.
How Much is the Mobile Game Market Worth in Germany
Germany generated $3.44 billion in revenue in the mobile games industry in 2022. The number of gamers is expected to reach 19.4 million by 2027, with a user penetration of 23.2%.
Mobile Gaming Penetration by Country
| Country | User Penetration By Percent of Population |
|---|---|
| United States | 44.90% |
| South Korea | 43.40% |
| China | 36.80% |
| Mexico | 34.70% |
| United Kingdom | 33.80% |
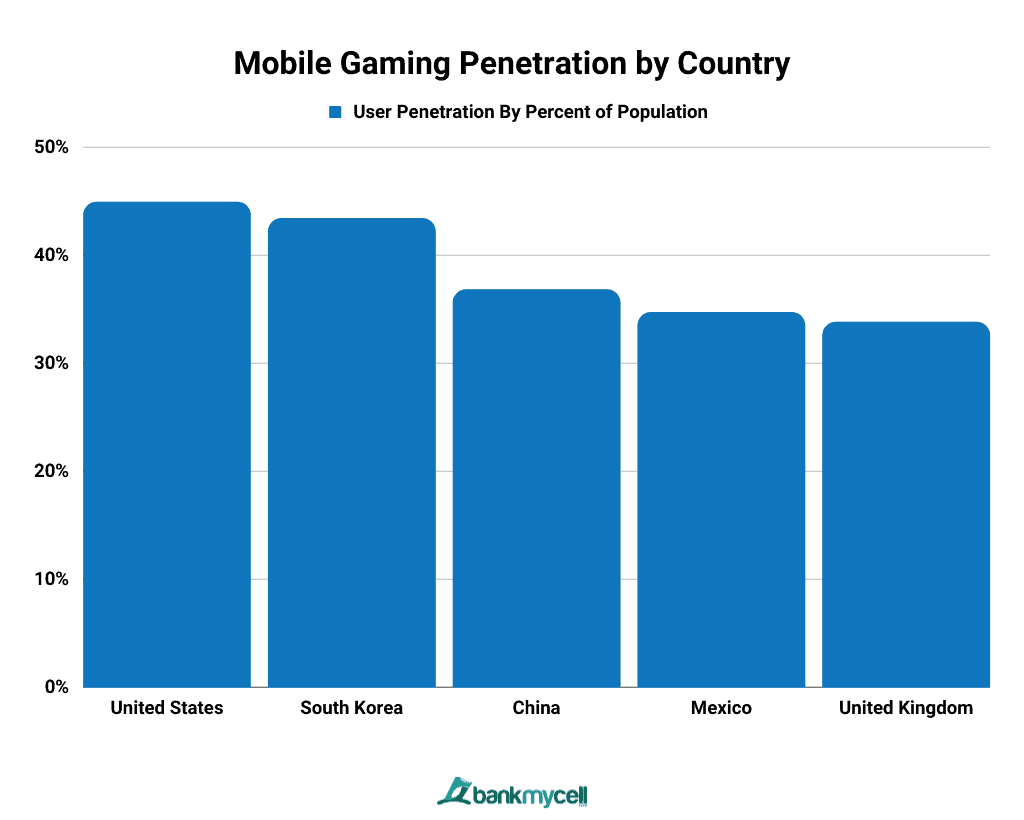
- Data Table
-
Country User Penetration By Percent of Population United States 44.90% South Korea 43.40% China 36.80% Mexico 34.70% United Kingdom 33.80% - Data Graphic
-

The United States has the highest user penetration in mobile gaming at 44.90% of the country’s population. This is followed by South Korea (43.40%). China comes in third with 36.80%, followed by Mexico with 34.70%. The United Kingdom ranks last with 33.80%.
Mobile Video Games Market Revenue Share by Year (2014-2022)
| Year | United States | Japan | China | South Korea | Taiwan |
|---|---|---|---|---|---|
| 2022 | 27% | 20% | 18% | 7% | 3% |
| 2021 | 29% | 21% | 17% | 7% | 3% |
| 2020 | 28% | 22% | 18% | 7% | 3% |
| 2019 | 26% | 23% | 20% | 6% | 3% |
| 2018 | 24% | 26% | 19% | 6% | 3% |
| 2017 | 23% | 26% | 21% | 7% | 2% |
| 2016 | 23% | 28% | 19% | 6% | 0 |
| 2015 | 26% | 30% | 11% | 7% | 0 |
| 2014 | 27% | 29% | 7% | 8% | 0 |
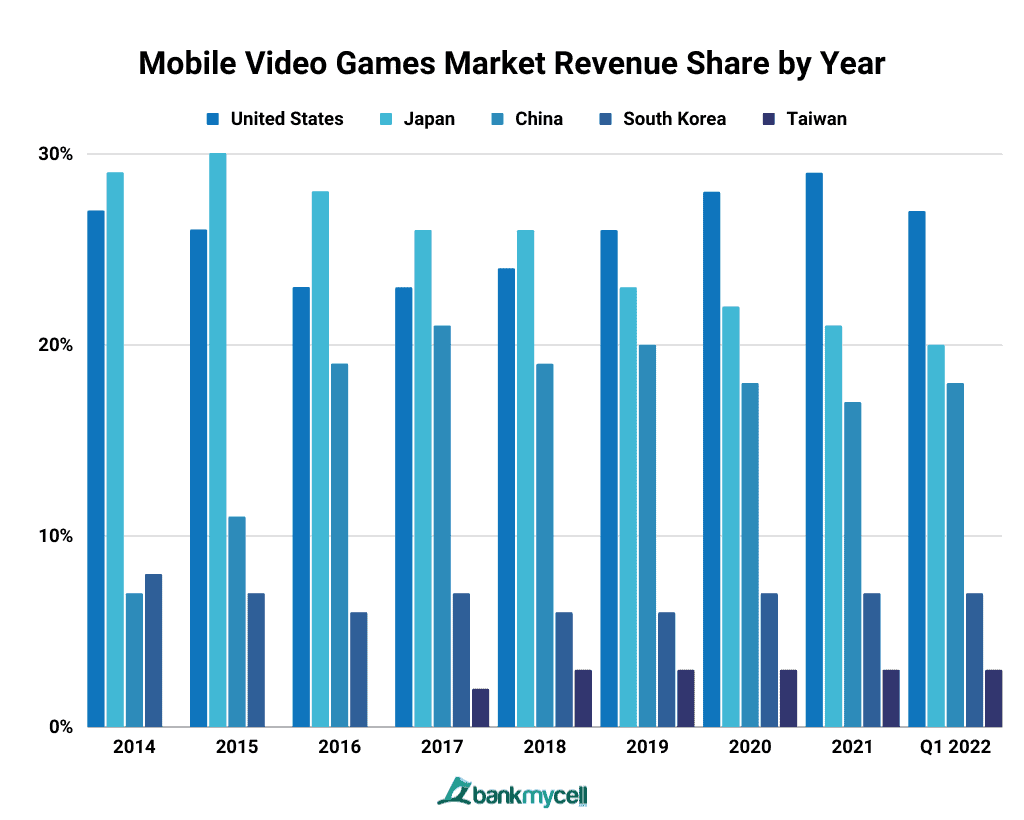
- Data Table
-
Year United States Japan China South Korea Taiwan 2022 27% 20% 18% 7% 3% 2021 29% 21% 17% 7% 3% 2020 28% 22% 18% 7% 3% 2019 26% 23% 20% 6% 3% 2018 24% 26% 19% 6% 3% 2017 23% 26% 21% 7% 2% 2016 23% 28% 19% 6% 0 2015 26% 30% 11% 7% 0 2014 27% 29% 7% 8% 0 - Data Graphic
-

The United States had the world’s largest mobile gaming market in the first quarter of 2022, reaching approximately 27% of consumer spending, although it falls off 2% compared to 2021. Japan has experienced a steep decline since 2016. It peaked at 30% in 2015 and will fall by 10% by 2022.