WHO ARE AMERICAS TOILET TEXTERS?
SMARTPHONE BATHROOM HABITS (TEXTING ON THE TOILET STUDY)

With generation Z growing up in the internet age and 66.7% of the world’s population having smartphones, we now have the largest demographic of digitally connected phone addicts. Smartphone manufacturers have been criticized for the addictive nature of their devices, everywhere you look someone is texting, tweeting or talking on a mobile – what about where you can’t see? Are you guilty of using your phone to the toilet?
Perhaps some privy habits are best kept private…

STUDY GOALS
BankMyCell’s survey set out to unearth the present state of smartphone usage in the toilet combined with confessions of the extent we go to stay connected. Further to other previous studies, we set out to uncover data that would highlight the bathroom cell phone use trends between gender, generation, and even the device operating system.
SURVEY RESEARCH FOCUS AREAS
BankMyCell surveyed 2,114 people in the U.S to build this report, for more information on the methodology and downloads click the button below:
KEY SURVEY FINDINGS
Demographic Usage Data
- 3 in 4 Americans admit to using their phone whilst on the toilet – View
- 80% of men surveyed admitted to using their phone on the toilet, compared with 69% of women – View
- 96% of Americans under 23 won’t go to the bathroom without their phone (Generation Z) – View
- 90% of millennials confess to being toilet texters by using their phone on the toilet – View
- 88% of Android owners use their device on the toilet (12% more than iOS) – View
- Georgia, California and New York have the highest popularity of toilet texting – View
Bizarre Smartphone Usage
- 78.5% of Americans under 23 (Gen Z) reveal apps are fundamental for toilet time – View
- 54% / Over half of Americans admit social media apps are the most used on the toilet – View
- 40.5% of Americans have set the toilet mood with smartphone music – View
- 35% of American males use the toilet as a private games arcade – View
- 25% of American males got a top score while gaming in the lavatory – View
- 1 in 10 of ‘Romantic’ American men confess to using dating apps on the throne – View
- 1 in 3 women own up to sending a snap from the bathroom – View
- 1 in 10 men confess to speaking to their boss (working from the water closet) – View
Dubious Smartphone Hygiene

DEMOGRAPHIC USAGE DATA
WHO IS USING CELL PHONES IN THE TOILET (GENDER, GENERATION, OPERATING SYSTEM & LOCATION)
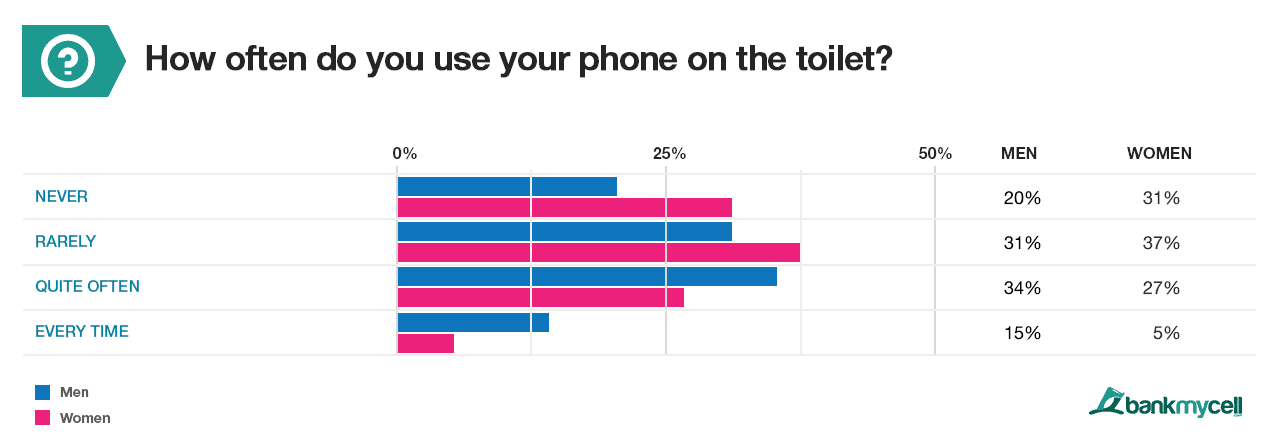
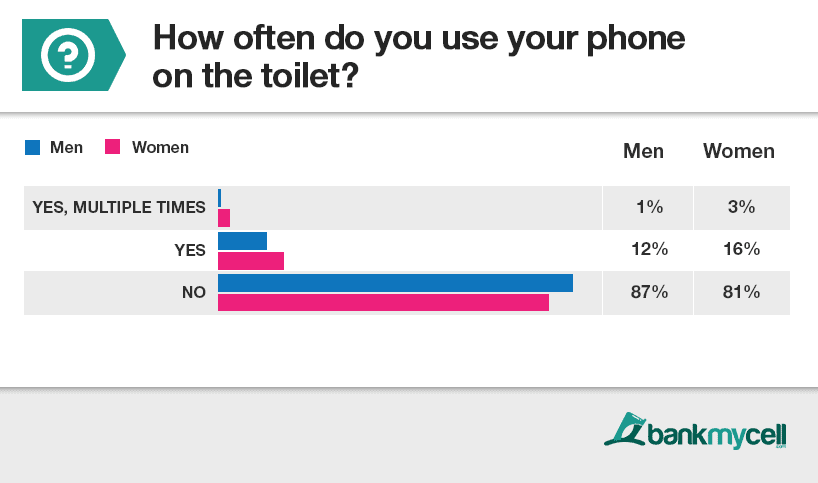
HOW OFTEN ARE PHONES USED IN THE TOILET?
BankMyCell began the survey by looking at the consistency of our subjects toilet texting behaviors. Our previous study on cell phone addiction illustrated the rise of dependence and the triggers of separation anxiety people get when absent from their smartphone.
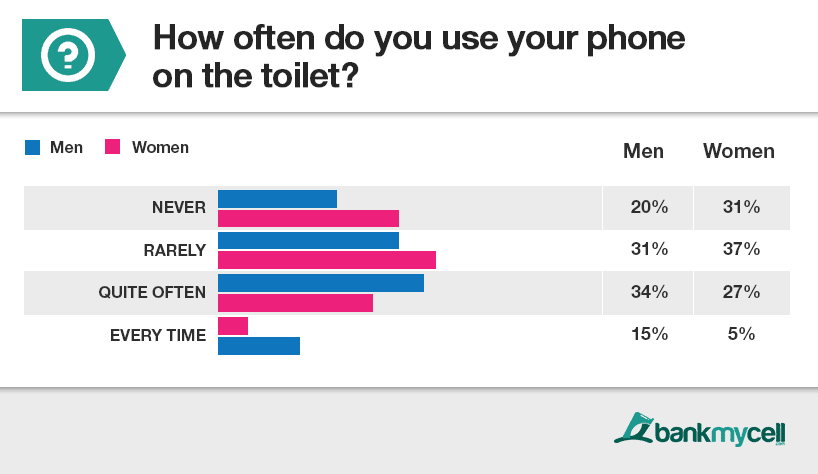
This new survey data suggests that that smartphone use in the bathroom is much more predominant in men, with a greater number of female respondents using it rarely to never. Additionally, previous surveys since 2011 show the average figure anywhere from 38 to 75 percent, so it’s interesting seeing that this average is swayed by 80% of males admitting to using their phone on the toilet.
Key Findings
- 3 in 4 Americans admit to using their phone while on the toilet (74.5%)
- 80% of men surveyed admitted to using their phone on the toilet, compared with 69% of women
- 49% of men divulged that they use their phone on ‘the throne’ often to every time
- 32% of women admit they’re heavy toilet texters, quite often to every time
- The average usage came in at: Never 25.5%, Rarely 34%, Quite Often 30.5%, Every Time 10%
OS & GENERATION SPLIT OF TOILET TEXTERS
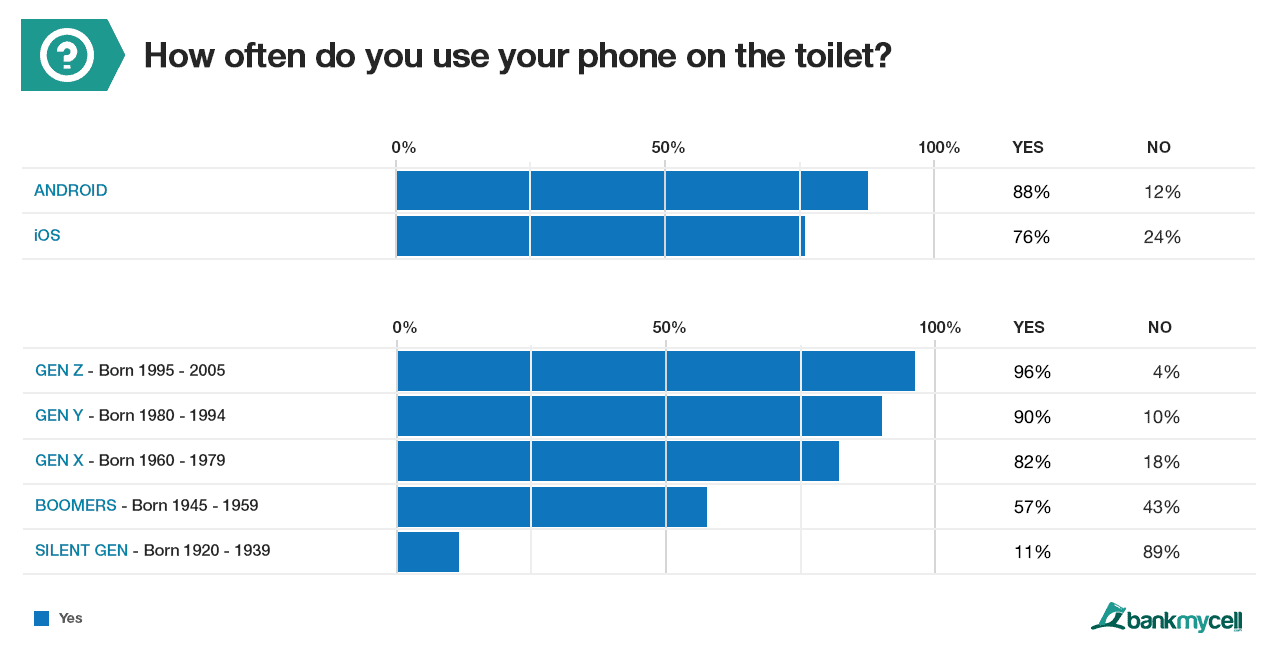
Surprisingly, 88% of Android users in the operating system specific survey topped iOS, making them 12% more likely to pick up their phone in the bathroom.
The study shows generation Z (96%) and Y (90%) have overwhelming toilet texting interactions, showing just how disturbingly dependent Gen Z and millennials are on smartphone interaction. It’s shown in previous studies that these generations have the highest global demographic smartphone ownership and addiction. This generation Z data is particularly concerning, our cell phone addiction report showed smartphone dependence to increase anxiety, stress, narcissism, depression, concentration issues and more.
Additionally, we were shocked to see 11% of the silent generation taking cell phones to the toilet too, the correlating low app usage data suggests this may be more of a convenience for mobility/sense of security among other possibilities.
Key Findings
- 88% of Android owners use their device on the toilet
- 76% of iPhone users prone to using their phones in the toilet
- 96% of Americans under 23 (Gen Z) won’t go to the bathroom without their phone
- 90% of millennials (Gen Y) won’t go to the bathroom without their phone
- 93% of Generation Z and Y are toilet texters
- Separation anxiety: Only 10% of millennials or 4% of generation Z don’t take their phone to the bathroom
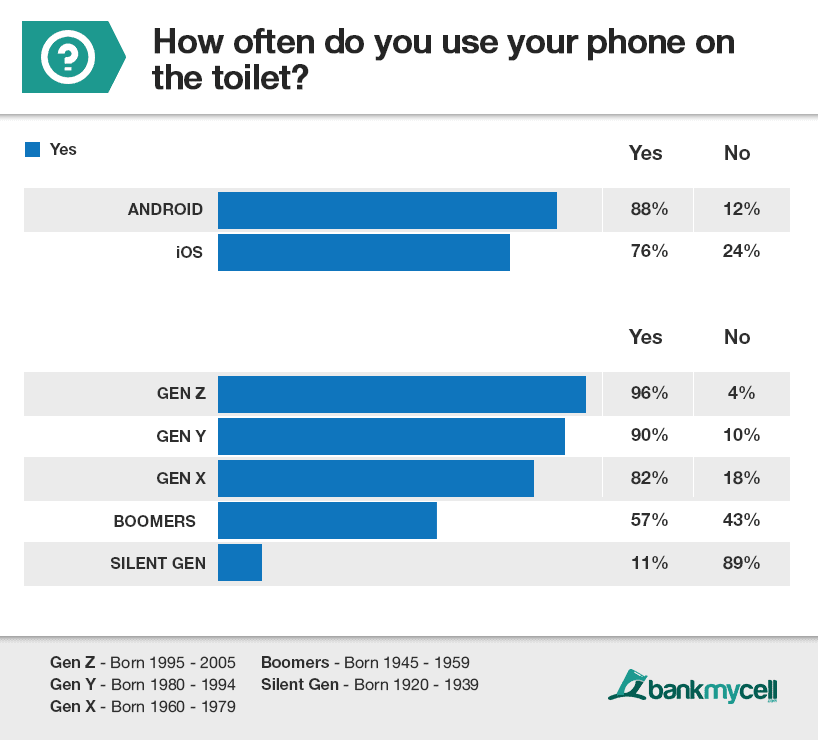
Generation Note: With so many overlapping generation-defining birth dates we standardized logical breaks correlating to popular suggestions from Wikipedia sources. These can be seen in the chart above.
U.S. STATE POPULARITY OF TOILET TEXTERS
During the specified timeframe of the survey, these were the U.S. states where cell phone usage in the restroom was the most popular. You can hover over each state on the interactive map to reveal the popularity scores or see the raw data in the table below.
Interactive Map
| No | U.S Region | Popularity |
|---|---|---|
| 1 | Georgia | 100 |
| 2 | California | 96 |
| 3 | New York | 96 |
| 4 | Mississippi | 95 |
| 5 | Pennsylvania | 95 |
| 6 | North Carolina | 94 |
| 7 | Florida | 94 |
| 8 | Virginia | 93 |
| 9 | District of Columbia | 92 |
| 10 | Texas | 92 |
| 11 | Michigan | 89 |
| 12 | Illinois | 86 |
| 13 | Louisiana | 86 |
| 14 | Nevada | 86 |
| 15 | Utah | 86 |
| 16 | Alabama | 85 |
| 17 | Arkansas | 85 |
| 18 | Indiana | 85 |
| 19 | Oregon | 85 |
| 20 | South Carolina | 85 |
| 21 | Tennessee | 85 |
| 22 | Delaware | 84 |
| 23 | Maryland | 84 |
| 24 | Missouri | 84 |
| 25 | Arizona | 83 |
| 26 | New Jersey | 83 |
| 27 | Wisconsin | 83 |
| 28 | Massachusetts | 82 |
| 29 | New Hampshire | 82 |
| 30 | Oklahoma | 82 |
| 31 | Rhode Island | 82 |
| 32 | Kentucky | 81 |
| 33 | Washington | 81 |
| 34 | Ohio | 80 |
| 35 | Colorado | 80 |
| 36 | Connecticut | 80 |
| 37 | Iowa | 80 |
| 38 | West Virginia | 80 |
| 39 | Minnesota | 79 |
| 40 | Hawaii | 75 |
| 41 | Kansas | 75 |
| 42 | Nebraska | 75 |
| 43 | New Mexico | 75 |
| 44 | Vermont | 74 |
| 45 | Maine | 71 |
| 46 | Idaho | 70 |
| 47 | North Dakota | 70 |
| 48 | South Dakota | 68 |
| 49 | Wyoming | 65 |
| 50 | Alaska | 64 |
| 51 | Montana | 64 |
BIZARRE SMARTPHONE USAGE
WHAT SMARTPHONE FUNCTIONALITY OCCUPIES THE MOST TIME IN THE BATHROOM
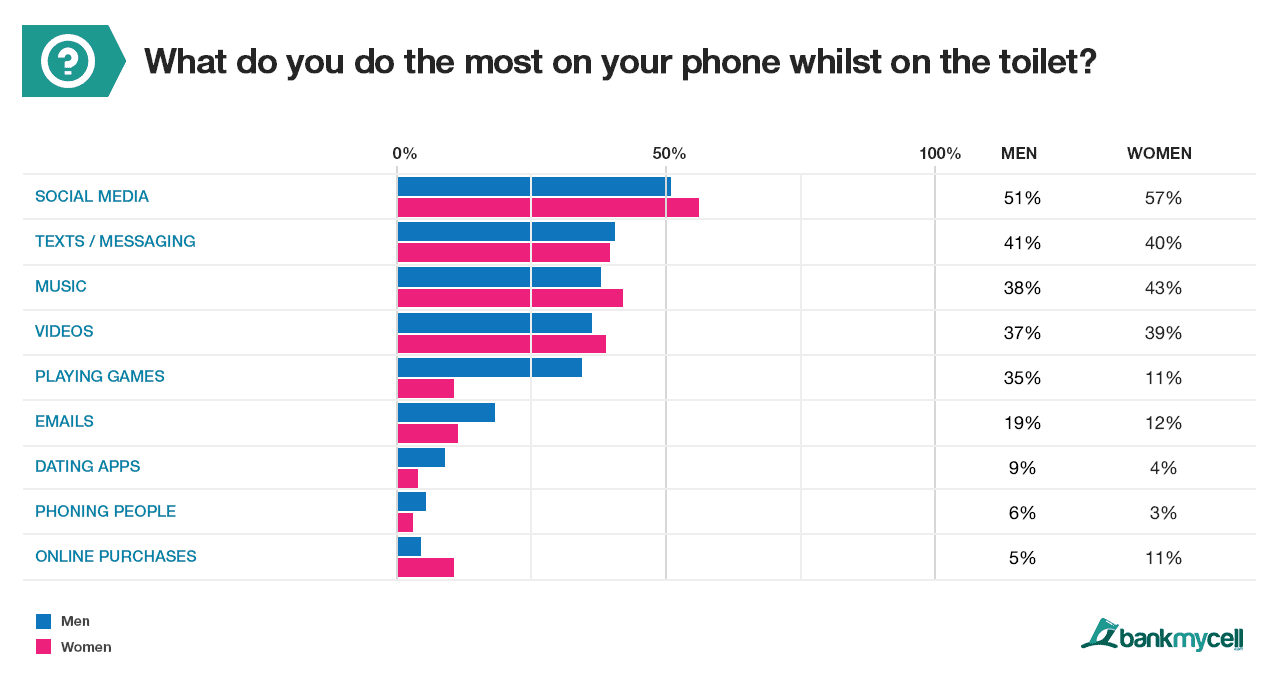
WHAT SMARTPHONE FUNCTIONS DO YOU USE ON THE TOILET?
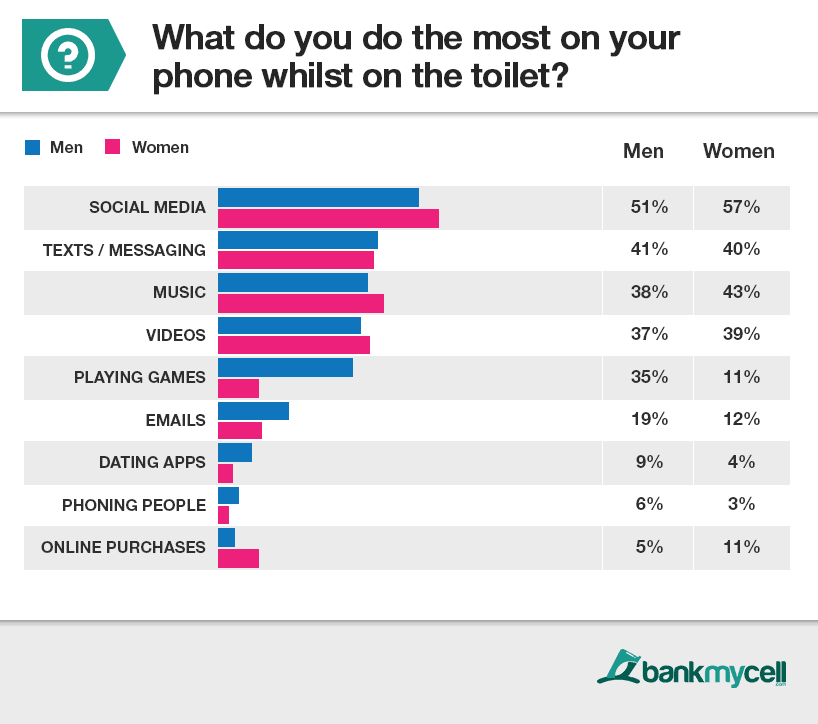
This survey data highlights the most popular uses of the smartphone during ‘toilet time’ by gender. Social media tops the list with over half of respondents confirming so in their top selections. Other noteworthy ways to ‘pass the time’ are messaging, setting the mood with media and that males loved turning the lavatory into a private games arcade. The most distressing find was one in nine males using dating apps, so in theory one of your matches on Tinder could have been from someone sat on ‘the throne’ …who says romance is dead!
Key Findings
- 54% of Americans admit social media apps are the most used on the toilet
- 40.5% of people have set the mood with smartphone music in the can
- 1 in 9 of ‘Romantic’ American men confess to using dating apps on the throne
- 35% of American men use the toilet as a private arcade room
- 40.5% of Americans admit to messaging while on the toilet
- 11% of female bathroom goers have done shopping from the toilet
- 1 in 5 American males have done their emails from the lavatory
WHO USES AN APP IN THE TOILET?
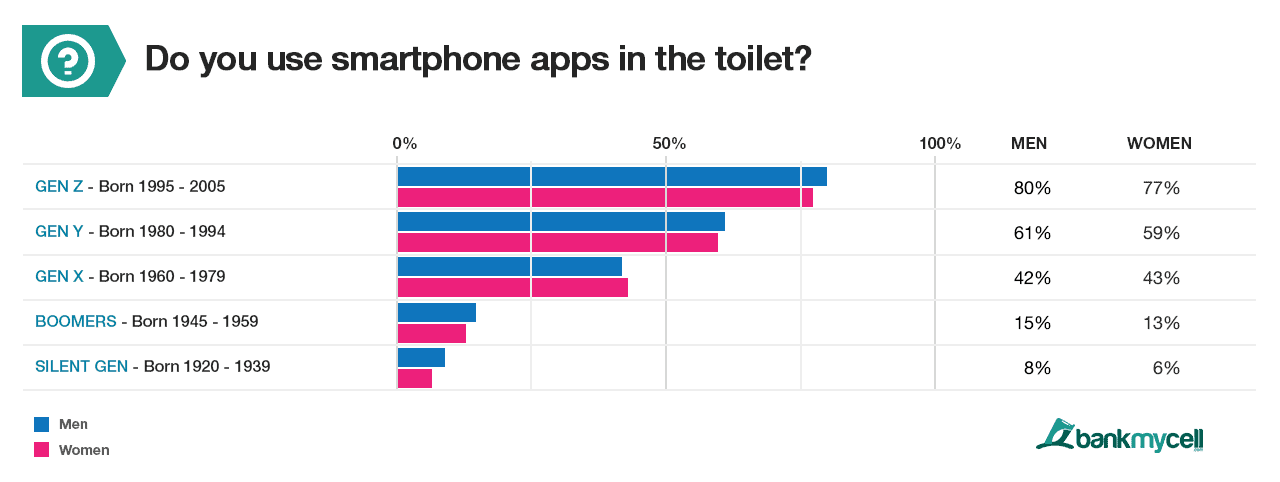
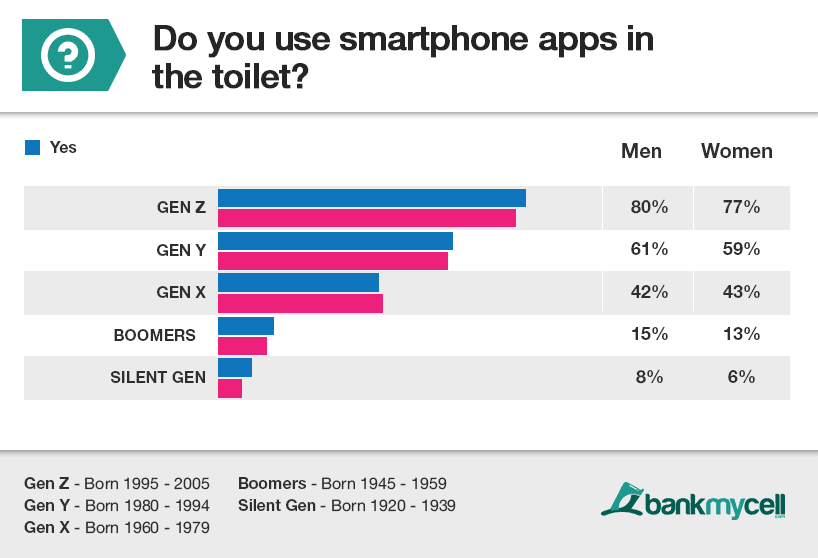
According to a study by LivePerson, 73.7 percent of Generation Z and Millennials rely heavily on interactions via phones and apps in comparison to real life. Messaging has also vastly surpassed calling so it’s no surprise they are the heaviest app users in the bathroom. This survey shows the demographic and gender split between them is dominated by Americans under the age of 23 (Generation Z).
Key Findings
- 78.5% of Americans under 23 reveal apps are fundamental for toilet time
- 60% of Millennials use their toilet time for smartphone apps
- 42.5% of Generation X confess to using smartphone apps in the bathroom
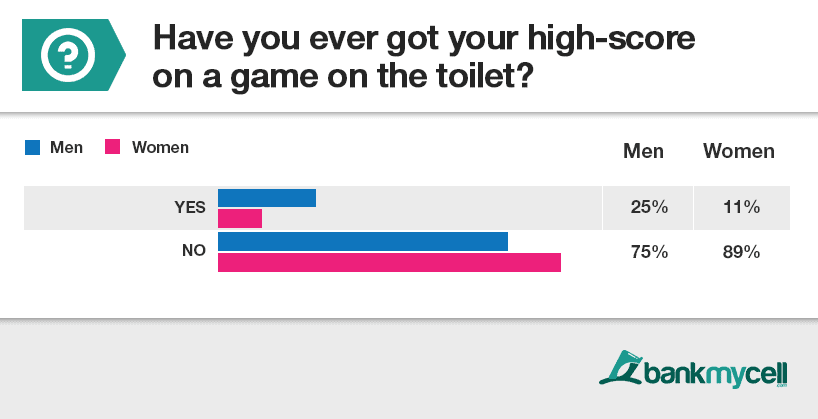
HAVE YOU EVER GOT YOUR HIGH-SCORE ON A GAME ON THE TOILET?
Is your roommate or spouse taking longer in the bathroom these days? Is that one guy at work in the bathroom for way too long every time? Well not only do 35 percent of men confess to using the toilet as a private games arcade, one in five American males have achieved their top score there!
Key Findings
- 1 in 4 American males are getting high scorers on smartphone games while sitting on the toilet
- Nearly 1 in 5 Americans confess to using the toilet for getting that top game score
- 1 in 9 Women have got their highest score on the can

HAVE YOU EVER SENT A SMARTPHONE PICTURE FROM THE TOILET?
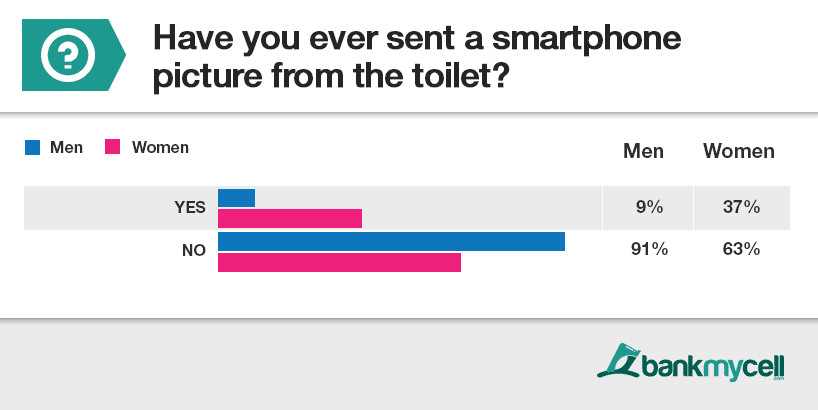
Sending pictures from the toilet could be interpreted in a variety of ways. Anything from mirror selfies, sending snaps to friends while getting ready for a night out and undoubtedly naughty snaps. Being optimists at BankMyCell we hope that snaps of actual toilet contents, but we have to face the likelihood it’s happened. This survey reveals 37 percent of women have taken a bathroom selfie compared to the mediocre 9 percent of men, with an average of one in five people sending toilet snaps.
Key Findings
- 1 in 3 women own up to sending a snap from the toilet (37%)
- Only 1 in 10 males have sent a snap from the bathroom
- 23% of Americans have sent a smartphone selfie from the can
- 77% of Americans have respectfully not sent a toilet selfie

HAVE YOU EVER ANSWERED A PHONE CALL FROM YOUR BOSS WHILE ON THE TOILET?
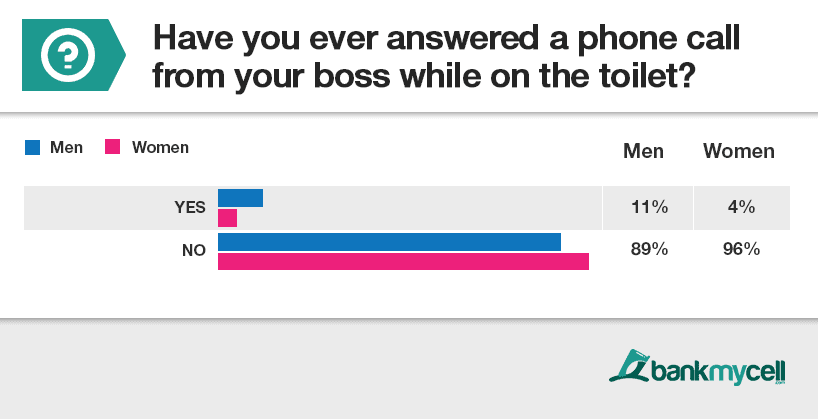
Many take a timeout from work in the one place of security (the bathroom) where people text, browse social media and even play games. However, if you’re on paid work time and your boss calls, what do you do? Well, one in nine men confessed to taking a call from their boss while on the toilet rather than waiting to call back after.
Key Findings
- Over 1 in 9 men confess to speaking to their boss from the throne
- 7.5% of Americans fess up to taking a call from their boss in the toilet

DUBIOUS SMARTPHONE HYGIENE
HOW MANY AMERICANS PROTECT THEIR PHONE ON THE POTTY
HAVE YOU EVER DROPPED YOUR PHONE DOWN THE TOILET?
The first shocking find is that nearly one in five women have taken their phone for a dip in the toilet. Really consider that for a moment, in comparison to men that have surveyed one in eight which is still astonishing. It’s worth noting most smartphone devices have water damage detectors which can void any manufacturer’s warranty or trade-in examination.
According to a survey by insurance firm Protect My Bubble, the bathroom is the second most common place to damage your smartphone.
Key Findings
- Nearly 1 in 5 women have taken their phone for a toilet swim
- Just over 1 in 8 men have dropped their phone down the toilet
- Women more likely to repeat offend dropping smartphones down the toilet
- Almost 1 in 6 Americans have dropped their phone down the privy!

WHAT'S YOUR PHONE HYGIENE COMPARED TO YOUR HANDS?
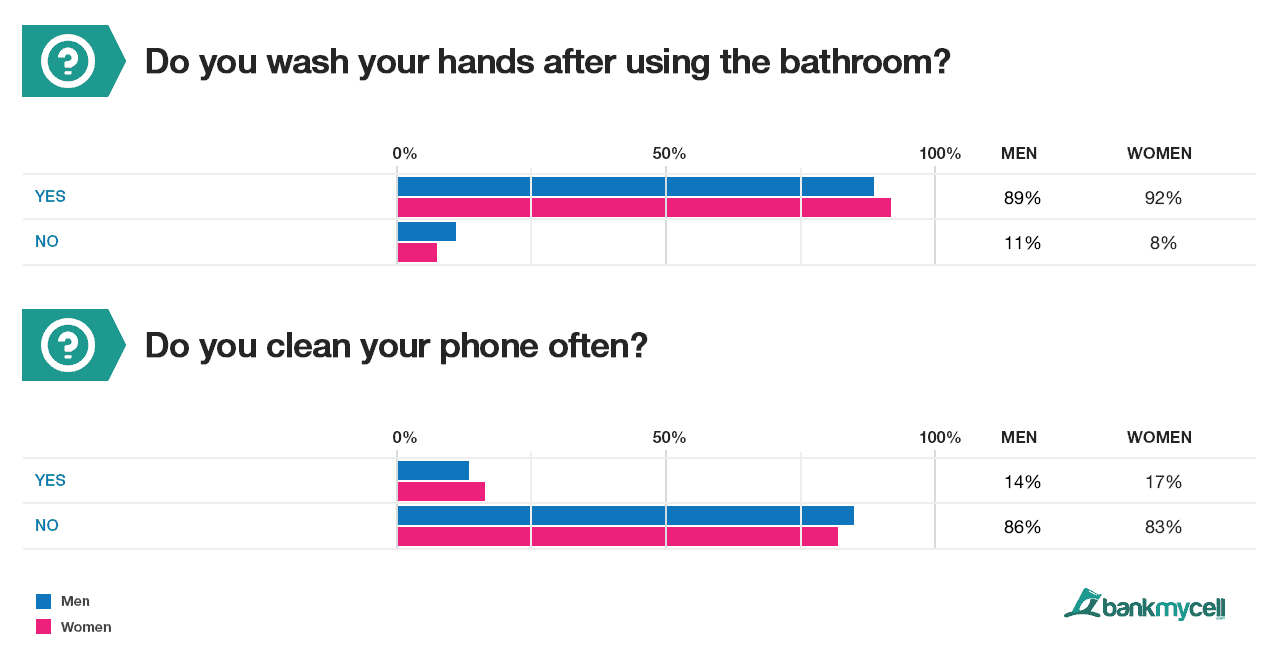
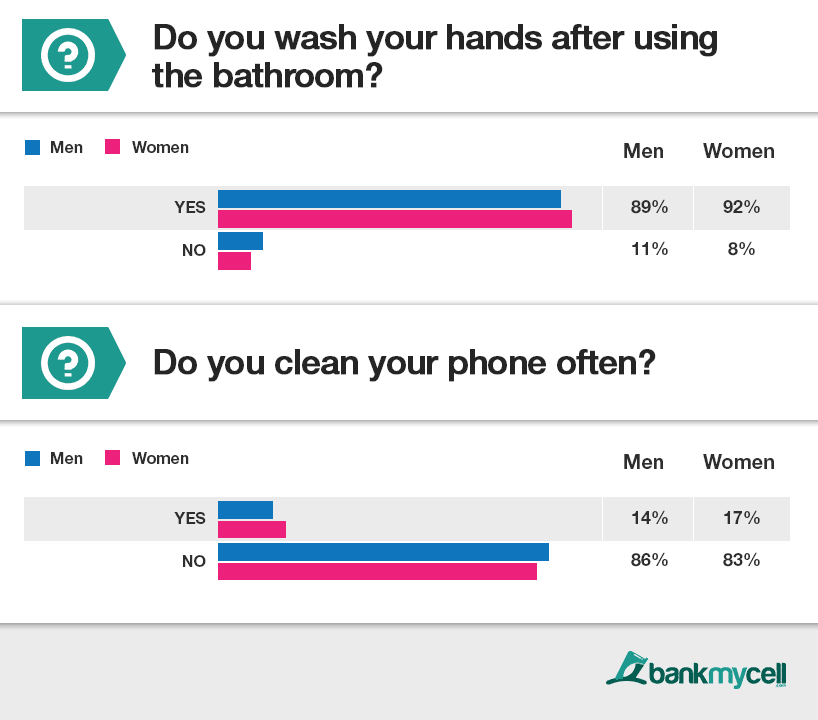
This nauseating survey result shows that 90% of Americans clean their hands but only 16.5% clean their phones. Which is shocking when 74.5% of the population take the phone to the bathroom. Scientists at the University of Arizona have found that cell phones carry 10 times more bacteria than most toilet seats. So maybe after you’ve spent 20 minutes on the toilet playing Fortnite, a quick wet wipe of your cell phone wouldn’t be such a bad idea.
Key Findings
- Cell phones are 10 times dirtier than toilet seats (only 1 in 7 Americans clean theirs)
- Almost 6 in 7 men confess to never cleaning their germ-ridden phone
- 87% of Americans clean their hands after using the toilet
- 84.5% of Americans don’t clean their phones (which are 10 times dirtier than toilet seats)
HOW MUCH IS YOUR PHONE WORTH?
To get an idea of the values you can get when selling your old phone in the US, check out our latest phone trade-in pricing below:
SURVEY RESOURCES
OUR STUDY METHODOLOGY AND DOWNLOADS
SURVEY DATA COLLECTION
A series of surveys were conducted by BankMyCell between 06/01/2018 to 08/31/2018.
BankMyCell’s surveys registered respondents gender, generation and operating platform then asked a series of questions. The core data from 2,114 people in the U.S was extracted and used in this report.
The survey tool collected additional information that came in useful in verifying the demographic side of the study. Information such as IP address, country, and state let us filter entries and isolate it to the U.S.
RESOURCE DOWNLOADS
PR Pack & Data Request:
We can supply all the data for free upon request, please visit our press room for contact details